
- XLM peaked at $0.9 but plunged to $0.1 by 2019, a 90% decline from its 2018 all-time high.
- XLM’s liquidation heatmap revealed key liquidity zones and price fluctuations between $0.262026 and $0.289401.
Stellar [XLM] has been in a general downtrend for quite some time. This has shown a historical pattern of sharp price fluctuations following peaks in its bubble risk oscillator.
The Short-Term Bubble Risk chart therefore tracks price in its oscillator levels.
The oscillator, ranging from 0 to 1, repeatedly spiked above 0.5, signaling high bubble risk. Notable spikes occurred in 2017, 2018, 2021, and 2025, each correlating with significant price drops.
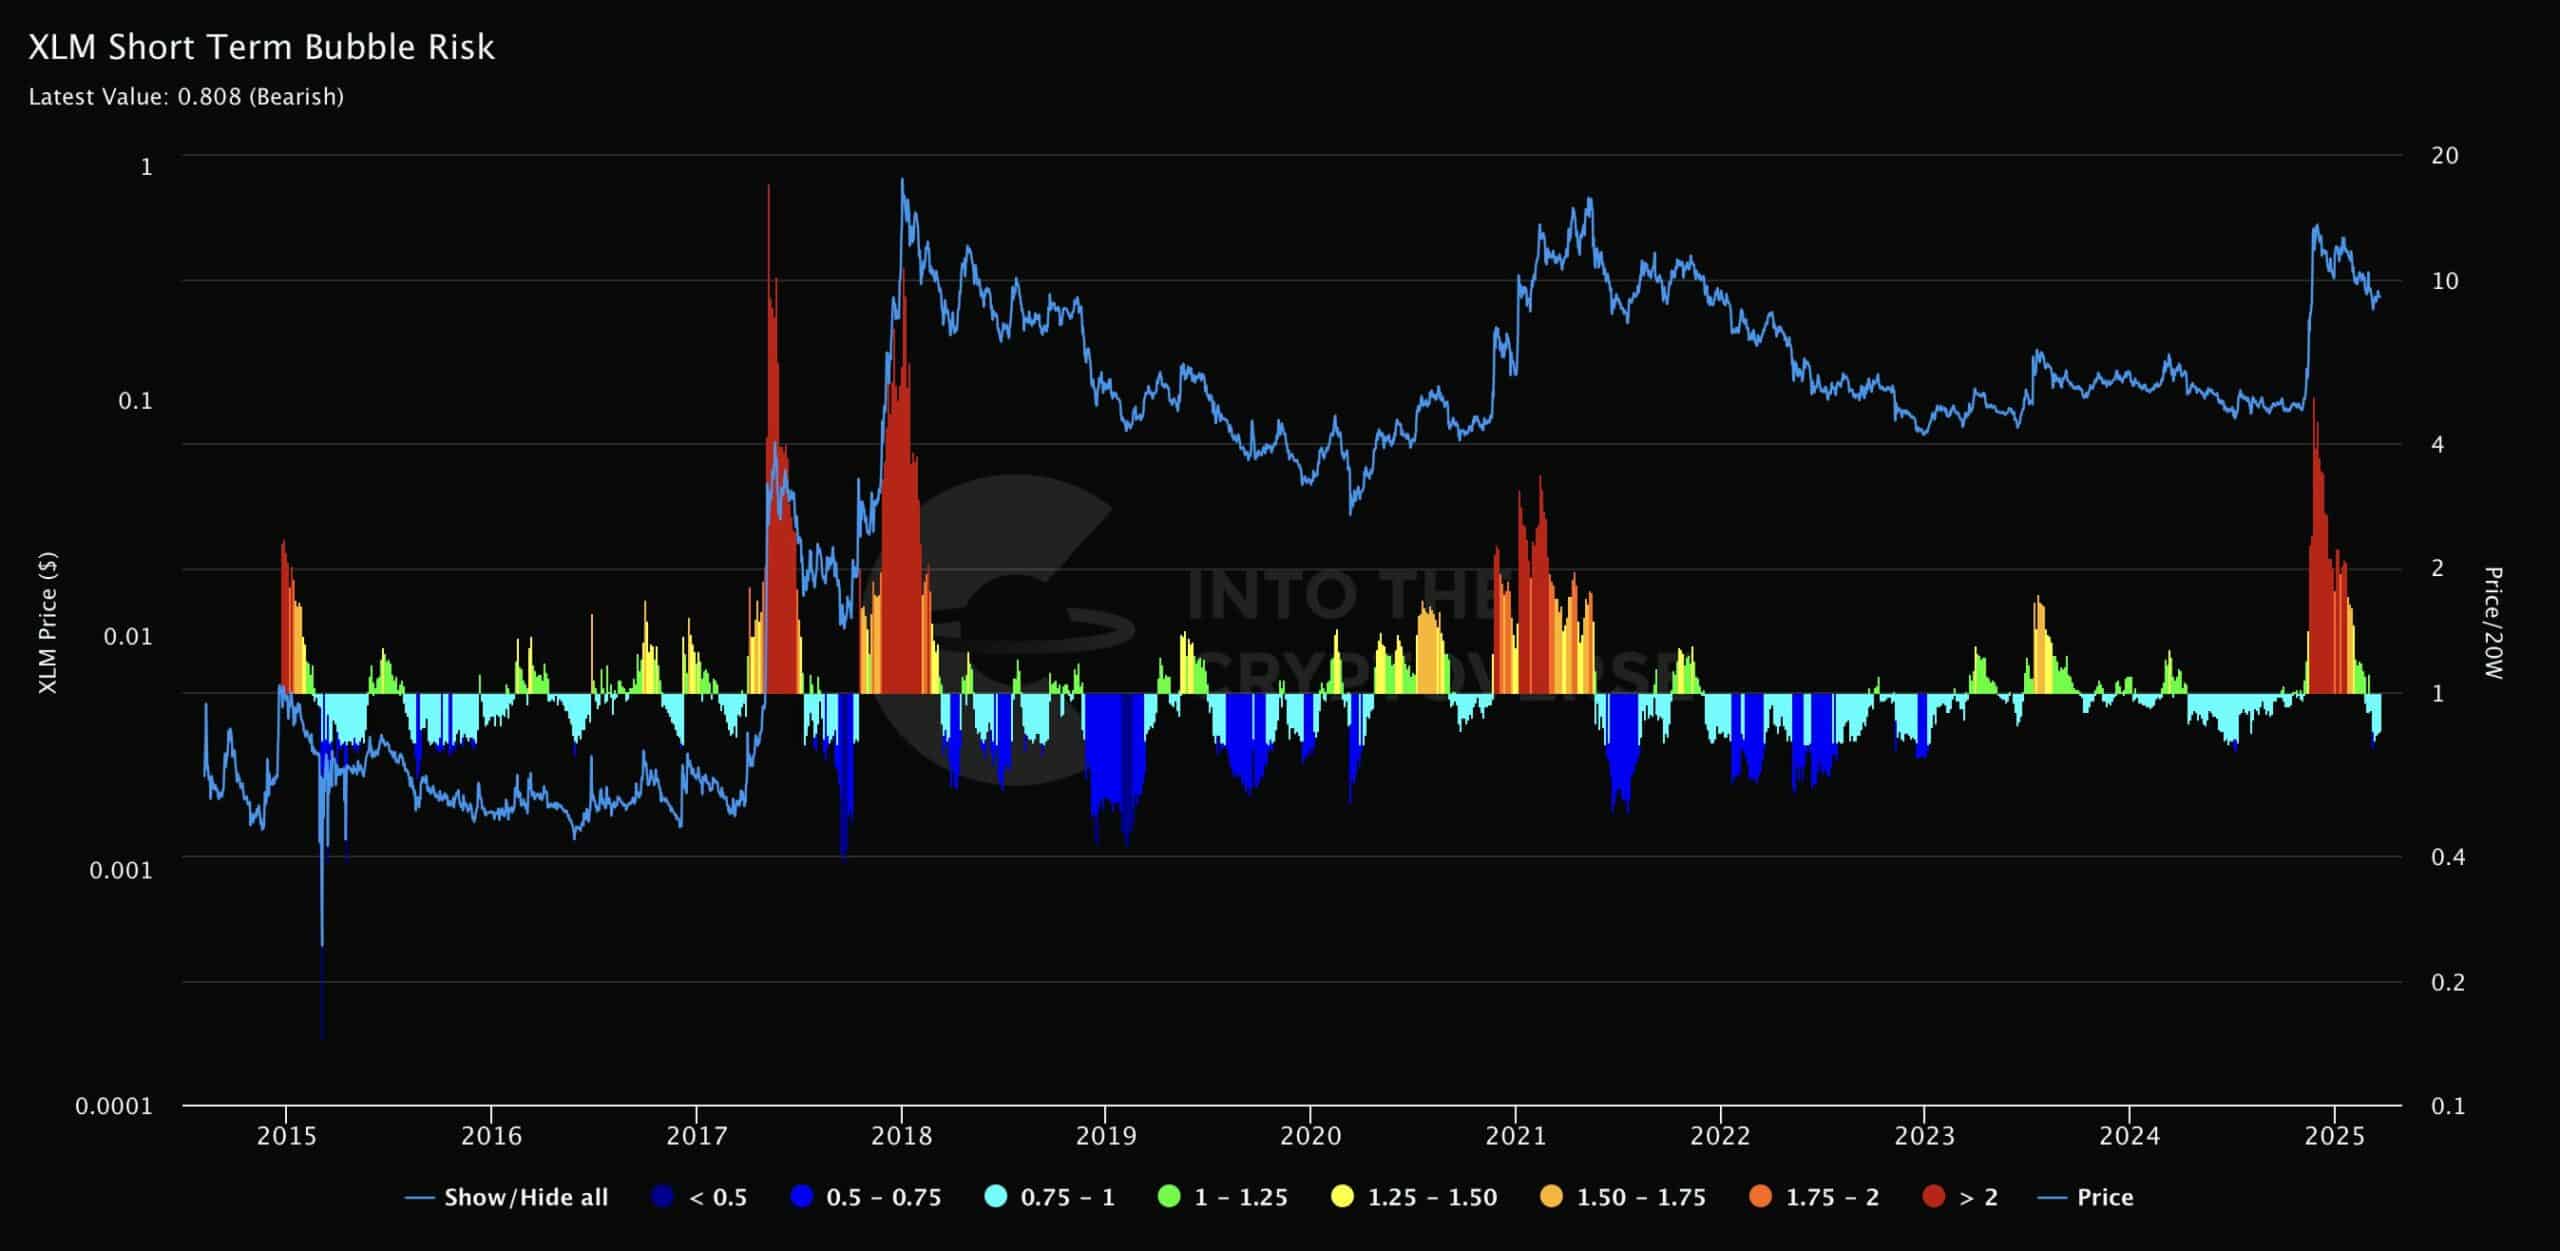
Source: IntoTheBlock
In 2017, XLM peaked at $0.9 but plunged to $0.1 by 2019, a 90% decline from its 2018 all-time high (ATH). A similar trend emerged in 2021, when XLM reached $0.7 before dropping to $0.1 by 2023.
In 2025, XLM briefly surged to $0.4 before falling back to $0.1, aligning with the oscillator’s peak at 0.808, indicating strong bearish momentum.
Historically, each oscillator spike above 0.5 has preceded a substantial decline, suggesting continued volatility.
Despite historical downtrends, a drop in the oscillator below 0.5 with stability could signal a reversal.
If XLM maintains a price above $0.4, it may break free from its pattern of steep declines, potentially entering a bullish phase.
XLM: Insights from ATH declines
The XLM Percentage Drawdown from ATH chart highlighted the coin’s price history and significant declines. After peaking at $0.9 in 2018, XLM dropped over 90% to $0.1 by 2019.
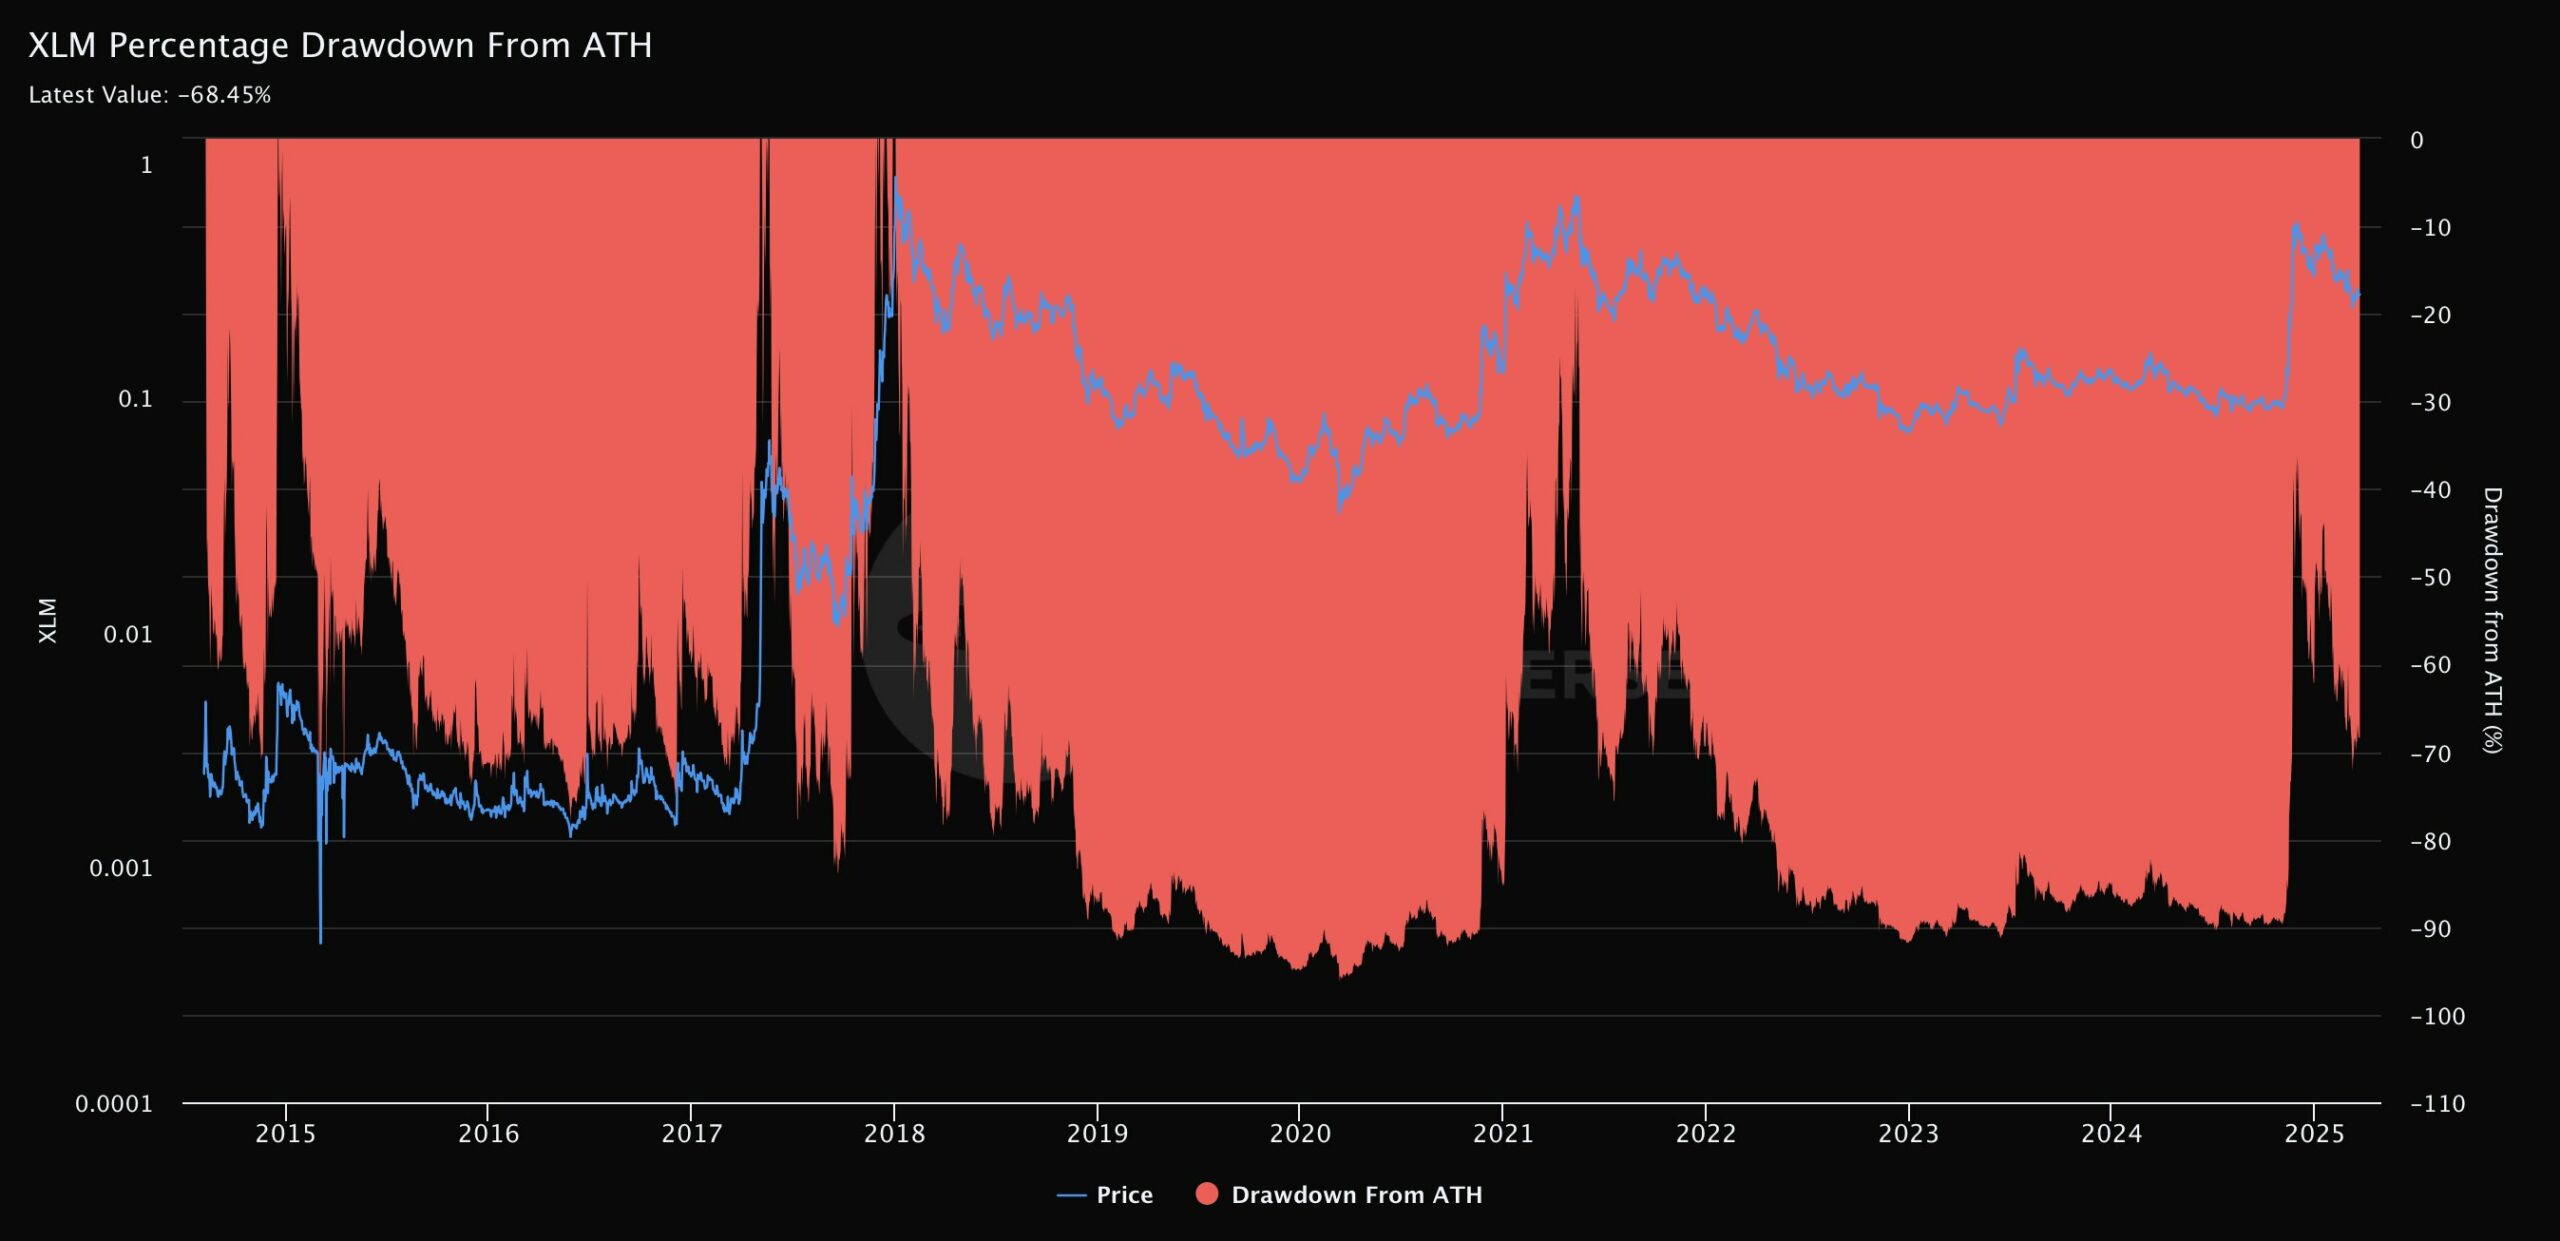
Source: IntoTheBlock
A similar peak at $0.7 in 2021 led to an -80% drawdown by 2022. In 2025, XLM briefly hit $0.4 before falling to $0.1, registering an -84.5% decline.
The consistent pattern of -80% to -90% drawdowns underscores the asset’s volatility and bearish tendencies.
Therefore, a sustained price above $0.4, combined with a drawdown of less than -50%, may indicate a bullish reversal. If XLM stabilizes with reduced volatility, it could shift away from its historical trend of steep declines.
Liquidation risks and safe entry zones
XLM’s liquidation heatmap reveals key liquidity zones and price fluctuations between $0.262026 and $0.289401. The press time price was $0.263026, with significant liquidation leverage above $0.28.
Dense clusters at $0.285 and $0.289401 highlighted high liquidation risks if prices rise.
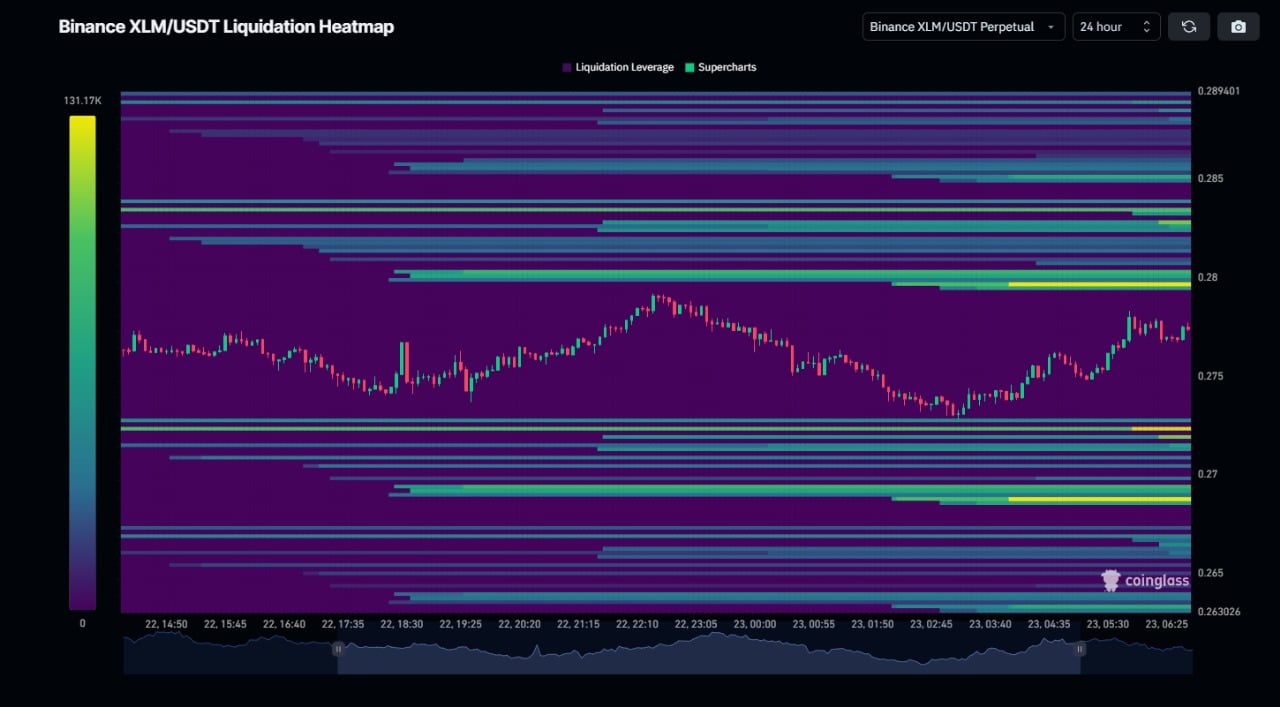
Source: Coinglass
Alternatively, lower liquidity pools exist at $0.27 and $0.265, with a relatively safer entry point near $0.262026, where liquidation pressure is minimal.
Thus, investors seeking lower liquidation risk may consider entering between $0.262026 and $0.265, avoiding positions above $0.28.
A breakout beyond $0.289401 with reduced liquidation pressure could signal a bullish trend, making entries above $0.29 more viable for momentum traders.
Finally, XLM’s historical trends indicate continued volatility, with sharp price corrections following oscillator peaks.
However, a stabilization in drawdowns and reduced liquidation pressure could offer a path for recovery.