
- Peter Brandt projected a likely short-term correction of BTC to $76K.
- But, Coinbase and other analysts expected an extended rebound amid renewed accumulation.
Bitcoin[BTC] rallied 6% last week and briefly reclaimed $85K; however, the cryptocurrency’s next move has kept bulls and bears equally divided.
According to renowned trader Peter Brandt, BTC’s rebound could be a set-up for an extra ‘corrective’ phase.
“The advance off the April lows looks more corrective than it does impulsive.”
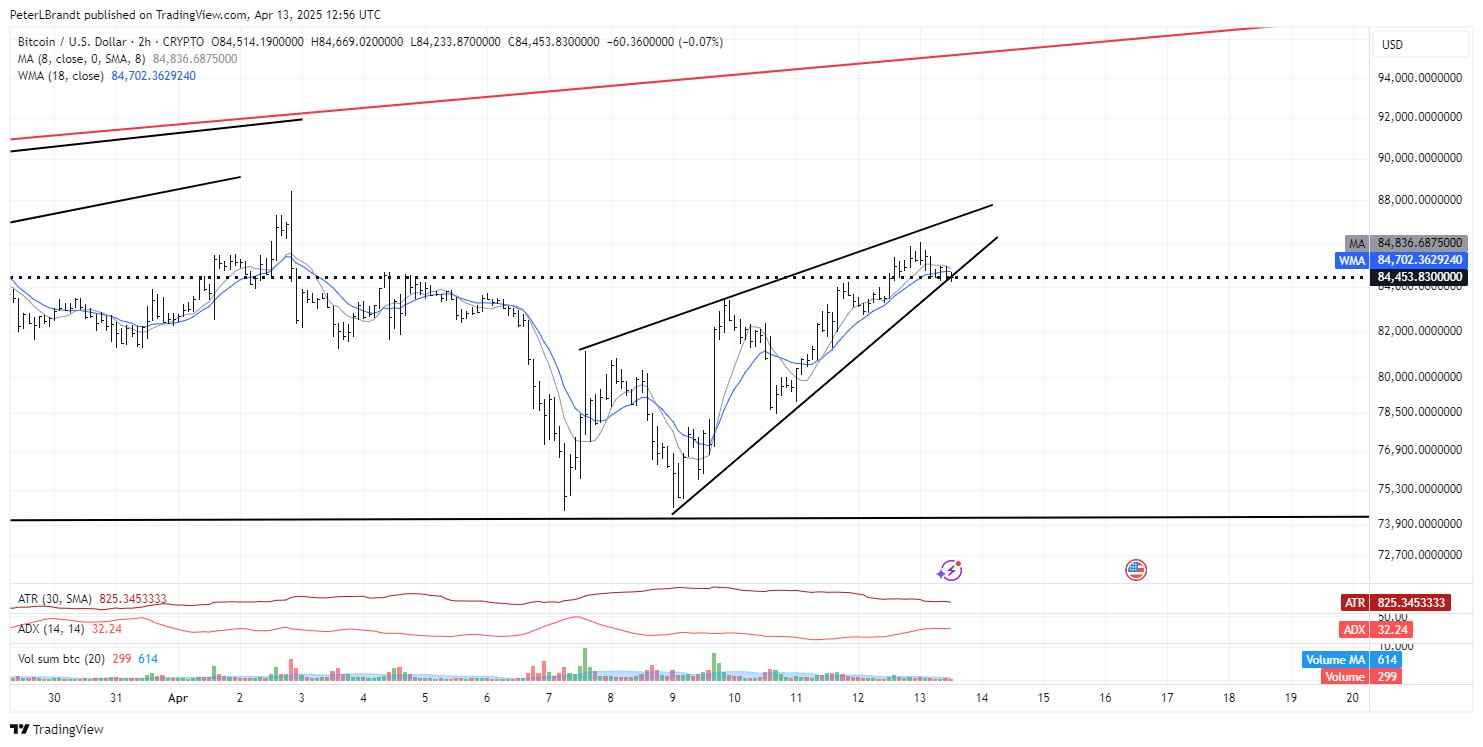
Source: BTC/USDT, TradingView
His argument was based on BTC’s bearish rising wedge on the 4-hour chart. The pattern could drag BTC to the $76K level if validated.
Even so, not all analysts were bearish, though.
BTC in a ‘buy zone’?
Coinbase analysts noted that BTC’s value was ‘fair’ and a ‘buying opportunity,’ citing renewed interest from long-term holders (LTH). In their weekly market report, the analysts said,
“While accumulation by LTH is not necessarily indicative of an imminent price jump, we do think it suggests that a growing segment of “fair value” buyers are seeing current BTC price levels as a buying opportunity.”
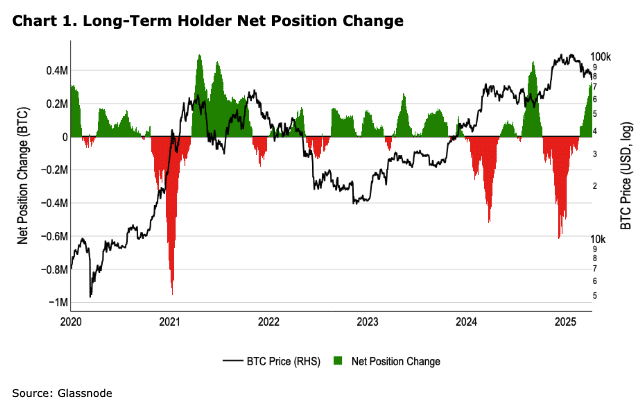
Source: Glassnode
Here, it’s worth noting that the LTH cohort has been key sellers (red) since late December when BTC surged above $100K. Whether the LTH sentiment shift will boost BTC’s recovery remains to be seen.
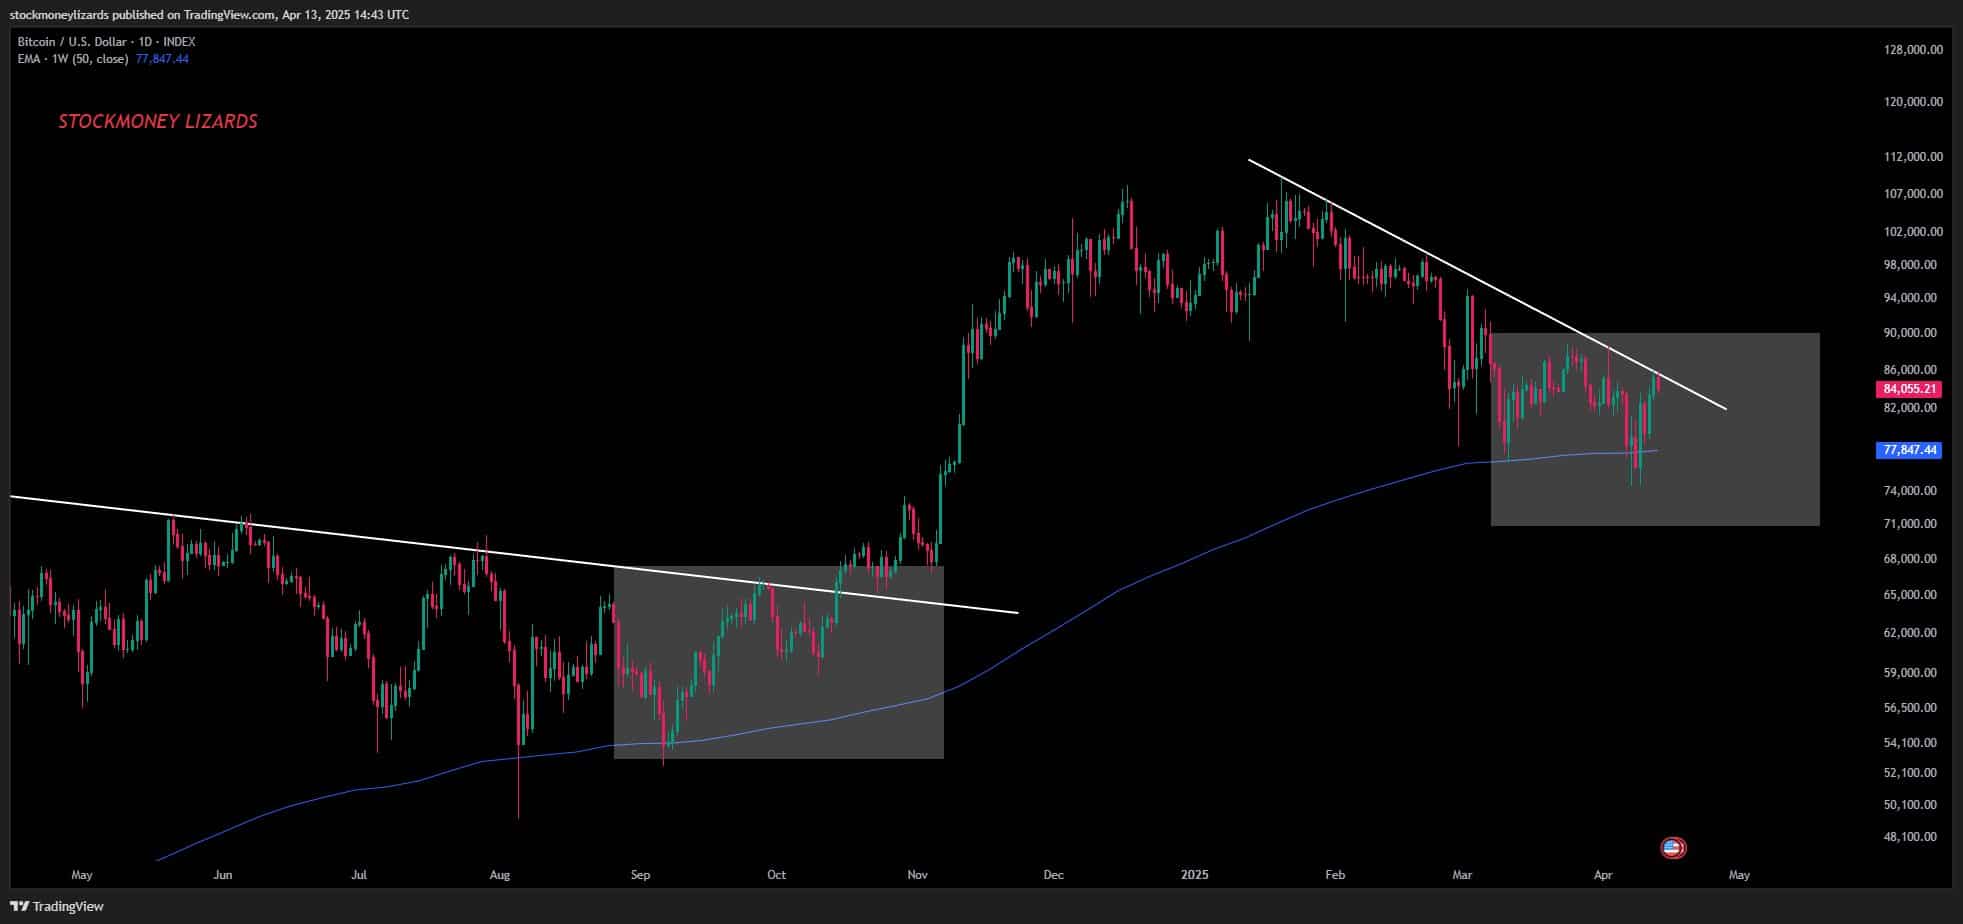
For his part, Stockmoney Lizards highlighted the similarity between the current price action and last year’s accumulation phase. He said a decisive move above $85K could mark the next leg up.
“72K-74K is our personal max pain accumulation target. When we break this trendline with conviction? That’s not just another pump – it’s potentially the start of the next leg up.”
Source: X
A similar sentiment was echoed by another analyst, Michael van de Poppe. Poppe noted that the bullish RSI divergence was a strengthening signal for BTC. He added that BTC could surge higher if it holds above $80K.
Meanwhile, there were three key levels to watch in the short term – $86K, $84K, and $82.7K. Coinglass’ liquidation heatmap on the 48-hour chart marked the above levels as key liquidity pools that could act as price magnets.

Source: Coinglass