
In brief
- Bitcoin rose 1.86% to $107,358 after Trump Media filed for a Bitcoin-Ethereum ETF listing.
- Ethereum surged 3.9%, boosted by its 25% allocation in the ETF and strong technical breakout above key levels.
- Global markets reeled from Israel-Iran escalation, but crypto trading volume jumped nearly 16%, signaling renewed investor conviction.
Global financial markets ended a turbulent week marked by escalating tensions between Israel and Iran, with traditional assets experiencing significant volatility while cryptocurrencies demonstrated surprising resilience—all things considered.
Israeli strikes on Iranian nuclear facilities on June 13 sent shockwaves through equity markets and triggered a flight to safety across multiple asset classes.
The S&P 500 dropped half a point last week, falling below the psychologically important 6,000 level following news of the airstrikes. The tech-heavy Nasdaq Composite declined 1.3% as investors grappled with the implications of a potential wider Middle East conflict.
Gold futures surged as much as 3.17% to around $3,468 per ounce as investors sought traditional safe-haven assets while crude oil prices experienced extreme volatility. West Texas Intermediate crude futures initially spiked almost 13% last week, reflecting concerns about potential supply disruptions from the world’s third-largest OPEC producer.
Despite these geopolitical headwinds, the cryptocurrency market showed remarkable resilience. The total crypto market capitalization increased 2.21% to $3.36 trillion, with trading volume surging 35.17% to $110.32 billion, according to Coinmarketcap. The Fear & Greed Index, which measures investor sentiment, sits at a neutral 50, reflecting a balance between caution over geopolitical risks and optimism driven by institutional developments.
Bitcoin surges 1.86% to $107,358 on Trump ETF Catalyst
Bitcoin demonstrated its evolving role as a non-correlated asset, climbing 1.86% to $107,358 over the past 24 hours despite the geopolitical turmoil. The catalyst today for crypto? President Donald Trump and his media group today followed through with plans to launch a joint Bitcoin and Ethereum ETF, according to an SEC filing.

The proposed exchange-traded fund would allocate 75% to Bitcoin and 25% to Ethereum, with U.S.-based exchange Crypto.com serving as the exclusive custodian and prime execution agent. Yorkville America Digital is acting as the sponsor, with shares expected to list on NYSE Arca pending SEC approval. It represents the latest expansion of Trump’s crypto ecosystem and could unlock billions in institutional flows if approved.
Adding fuel to the rally, Japanese investment firm Metaplanet executed a massive Bitcoin acquisition, purchasing 1,112 BTC for $117.2 million at an average price of $105,435. The purchase brings Metaplanet’s total holdings to 10,000 BTC. CEO Simon Gerovich emphasized the strategic nature of the acquisition, with the company now targeting 210,000 BTC by 2027 as part of its “555 Million Plan.”
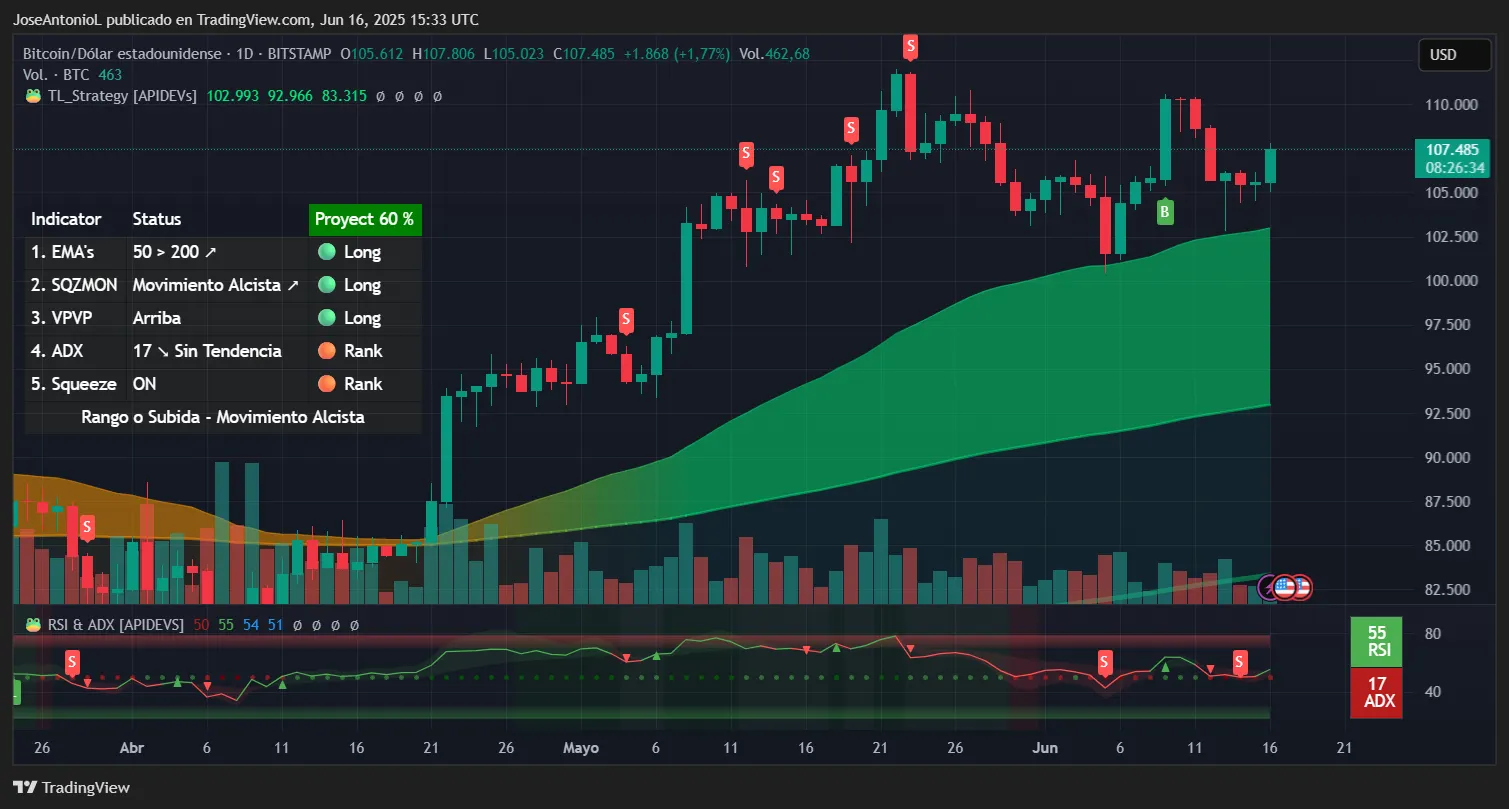
The weekly chart reveals Bitcoin consolidating within a critical zone between $100,000 and $110,000 since mid-May. The Average Directional Index, or ADX, which measures trend strength, reads 26 on the weekly timeframe, indicating a moderately strong uptrend with room for further acceleration. An ADX reading above 25 confirms the trend has legitimate momentum, though it hasn’t reached the extreme levels above 40 that often precede major corrections. In other words, there is a bullish mood among traders in short to medium timeframes, but traders realizing gains are currently pushing the brakes on the price trend.
The 50-week Exponential Moving Average (average price over the last 50 weeks), or EMA 50, on the weekly chart for Bitcoin sits at $85,941, having provided crucial support during recent pullbacks. The 200-week EMA (average price over the last 200 weeks) at $55,132 remains far below current BTC prices, confirming the long-term bullish market structure. This significant gap between current price and the 200 EMA suggests powerful underlying momentum that would require a major market event to reverse.
The Relative Strength Index, or RSI, reads 65 on the weekly timeframe, approaching but not yet reaching the overbought territory above 70. The RSI measures whether an asset is being overbought or oversold, or if the price movement could be considered healthy. At 65 points for Bitcoin, this positioning suggests room for continued upside before technical exhaustion sets in. The current weekly candle opened at $105,612 and is forming what appears to be a bullish engulfing pattern if it closes above last week’s high of $107,788.
The Volume Profile Visible Range, or VPVR, indicator highlights massive accumulation between $80,000 and $90,000, creating a strong support foundation that would be difficult for bears to break. What this means is, basically, a lot of people have traded at this price zone, so it is more likely to see them set a stop loss near this zone (without net losses) instead of somewhere below it. In other words, this serves as a reference for price support and resistance.
The weekly chart shows price action respecting a rising channel, with the upper boundary near $110,000 acting as immediate resistance. A decisive break above this level with volume confirmation would target the all-time high at $111,970, followed by the psychological $115,000 level.
Key Bitcoin Levels to Watch:
- Resistance: $110,000 (channel top), $111,970 (ATH)
- Support: $105,409 (weekly pivot), $100,000 (psychological), $85,941 (50-week EMA)
Ethereum outperforms with 3.9% surge to $2,649
Ethereum posted the strongest gains among major cryptocurrencies, rallying 3.9% to $2,649 as the Trump ETF filing positioned it alongside Bitcoin in a major institutional product. Trading volume exploded 49.5% to $19.7 billion, significantly outpacing Bitcoin’s volume increase and confirming strong buyer conviction.
Technical momentum aligns with improving fundamentals following May’s successful Pectra upgrade. The network enhancements, including raised staking limits for validators and increased scaling capacity for layer-2 networks, address longstanding efficiency concerns. Investments into Ethereum ETFs tell a compelling story: spot ETH ETFs had recorded 19 consecutive days of gains totaling $1.37 billion before a recent pause.
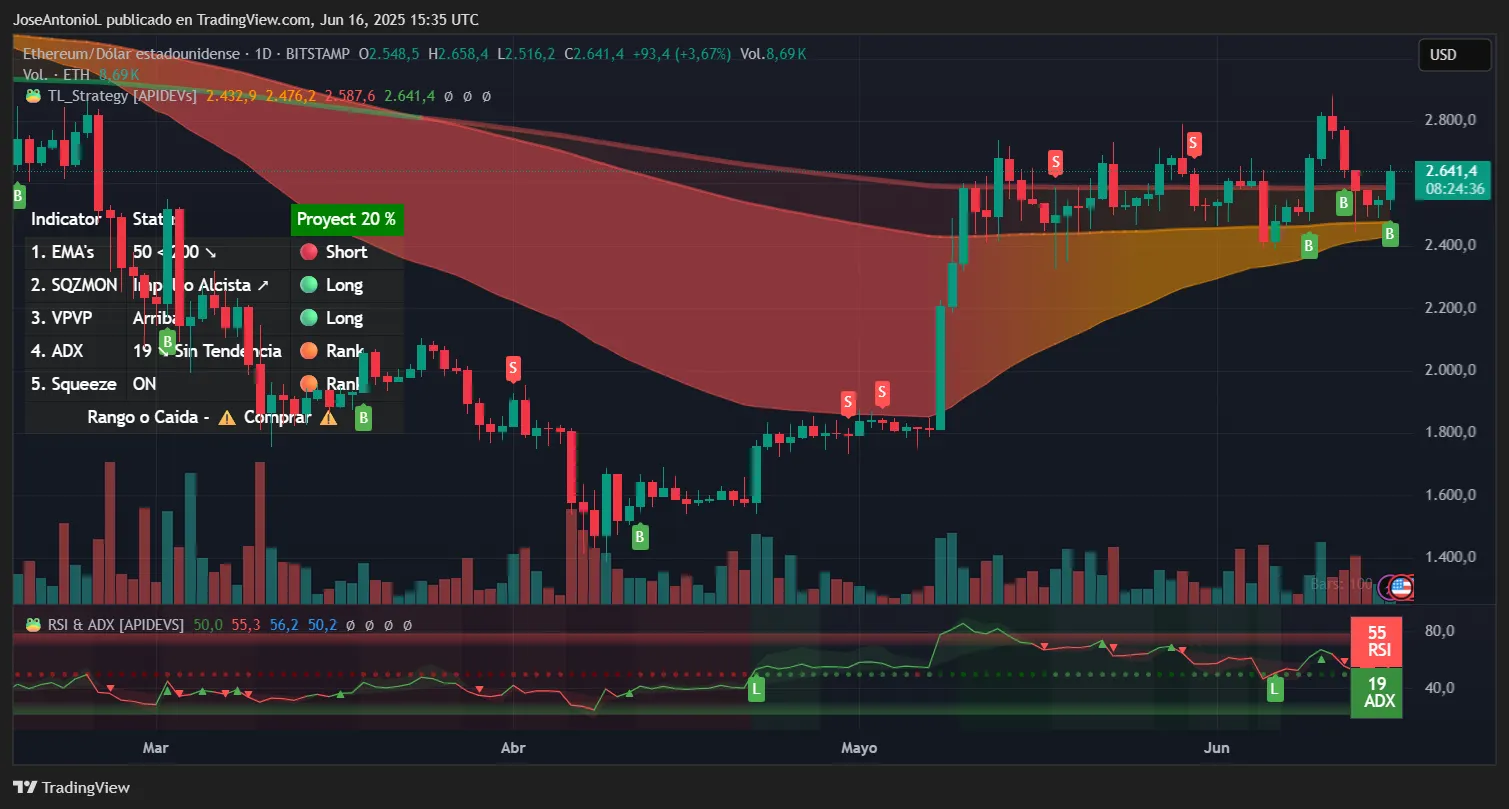
The weekly chart shows Ethereum breaking out of a multi-week consolidation pattern, with price action now testing an important retracement level at $2,752. The bounce from the support at $2,523 was decisive, accompanied by expanding volume that confirms genuine accumulation rather than short covering.
The ADX reads 23 on the weekly timeframe, indicating a weak to moderate trend that’s beginning to gain strength. While an ADX below 25 typically suggests consolidation, the recent uptick combined with price breakout signals potential trend acceleration. This setup often precedes explosive moves as momentum builds from a low base.
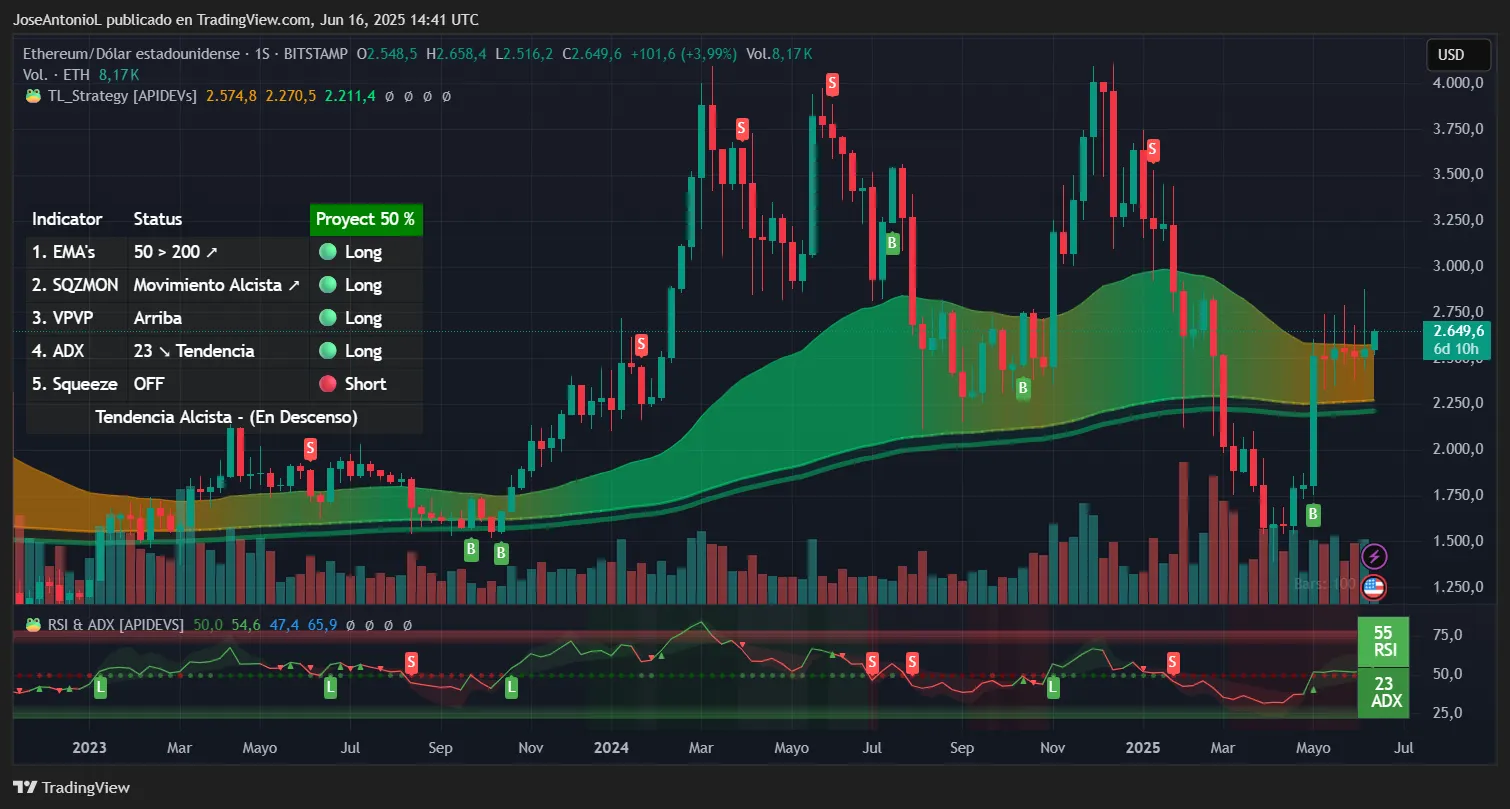
The 50-day EMA on the weekly chart sits at approximately $2,574, with the current price trading above this key level for the first time in several weeks. The 200-day EMA is at $2,270. The current gap stopped getting smaller which can point to a weakening of the bearish correction, and a consolidation zone before a major jump. If the short term EMA remains higher than the long term EMA, the overall trend is that the asset remains in bullish territory.
The RSI reads exactly 55 on the weekly timeframe—neutral, slightly bullish territory offering maximum flexibility for directional movement. Traders may view this positioning as particularly bullish given the recent price surge, as it suggests the rally has substantial room to run before reaching overbought conditions above 70.
Key Ethereum Levels to Watch:
- Resistance: $2,752 (0.236 Fib), $2,800 (round number), $3,000 (psychological)
- Support: $2,523 (0.618 Fib), $2,400 (volume POC), $2,270 (200-week EMA)
Disclaimer
The views and opinions expressed by the author are for informational purposes only and do not constitute financial, investment, or other advice.
Daily Debrief Newsletter
Start every day with the top news stories right now, plus original features, a podcast, videos and more.