
In brief
- Bitcoin holds steady near $102,000 as Fed maintains rates at 4.25-4.50%, with oil prices jumping above $78
- Meme coins SPX6900 and Fartcoin surge 15% and 13% respectively, seemingly immune to macro factors.
- Technical indicators show bullish momentum building for meme coins while major cryptos consolidate
Bitcoin and the broader crypto market displayed remarkable resilience Monday as oil prices fell near 6% after touching a five-month high following U.S. airstrikes against Iran over the weekend and the fears of Iran closing the Strait of Ormuz.
The S&P 500 rose to 6,006 points today, gaining 0.52% from the previous session, hovering just over the psychologically important 6,000 level first breached earlier this month. The Federal Reserve held rates steady for the fourth meeting in a row at 4.25%-4.5%, maintaining its wait-and-see approach amid uncertainty about tariff impacts and Middle East tensions.
Gold sits near $3,388 per oz as investors hedge their bets while oil’s sizable dip today removes one inflation concern from the Fed’s radar and shows markets don’t really see a global escalation at least in the short term.
But this is crypto, and while institutions might tread carefully deciding where to invest, retail traders pile into high-risk, high-reward meme coins that seem immune to macroeconomic factors.
Bitcoin and Ethereum: The majors mark time
Bitcoin has gained 2.35% in the past 24 hours to trade at $102,044, bouncing sharply from the weekend’s panic episode that took the prices to lows near $99,000. The move represents a critical test of the psychologically important $100,000 level that has captivated market participants, strengthening its position as a solid support stop.
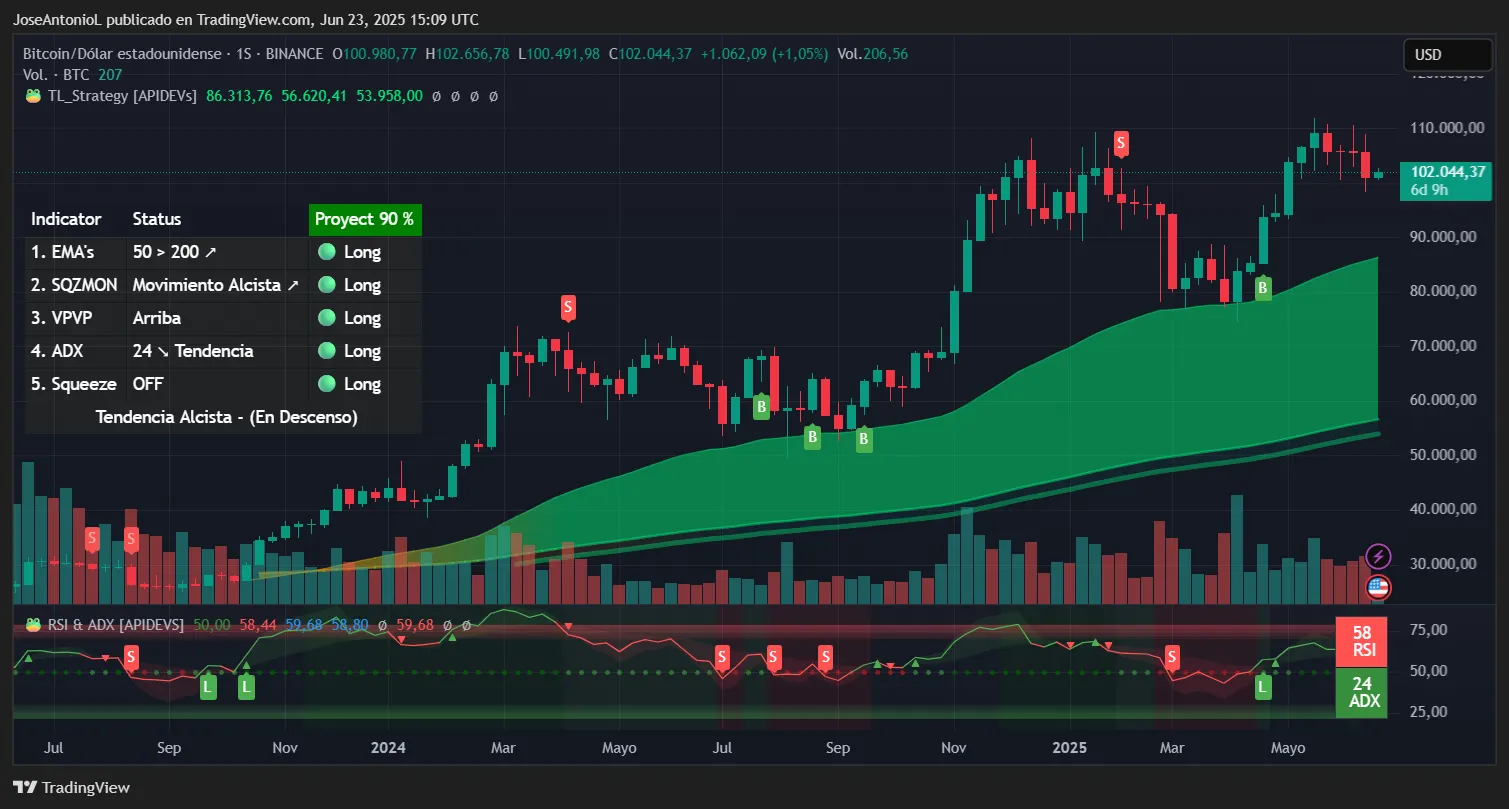
The Relative Strength Index at 58 indicates mild bullish momentum without approaching overbought territory (above 70). This “goldilocks” reading suggests Bitcoin has room to run higher without triggering immediate profit-taking. The RSI measures whether an asset is overbought (above 70) or oversold (below 30). Think of it as the market’s temperature gauge. When RSI drops below 30, it often signals that sellers have exhausted themselves, setting up potential rebounds.
Bitcoin currently trades above its 50-week EMA (approximately $86,000 based on the chart) but faces resistance from multiple timeframe convergences. The expanding gap between the average price of Bitcoin over the last 500 weeks and 200-week EMA typically indicates sustained buying pressure, which traders typically interpret as bullish for medium-term holders.
Key Levels for Bitcoin are quite close because the coin has been trading sideways for a while:
- Immediate support: $100,000 (psychological level and options concentration)
- Strong support: $86,000 (50-week EMA zone)
- Immediate resistance: $107,000 (recent rejection point)
- Strong resistance: $110,000 (approach to all-time high territory)
Ethereum’s weekly chart tells a more constructive story, with the second-largest cryptocurrency trading at $2,285 after a major price jump in April. The technical setup suggests accumulation beneath resistance.
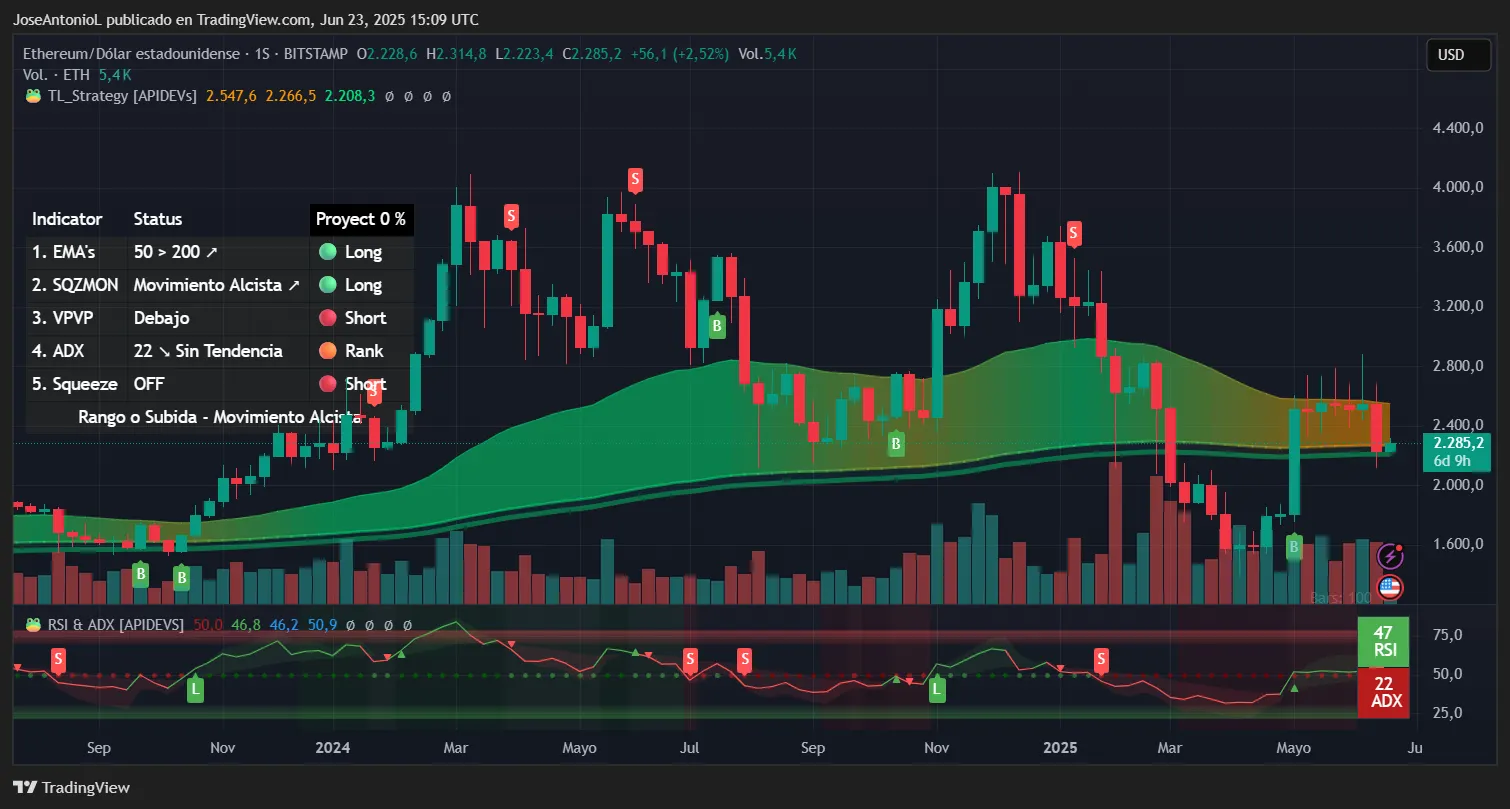
The RSI at 47 sits in neutral territory, indicating neither overbought nor oversold conditions. This middling reading often precedes directional moves, as it shows the market has digested recent gains without excessive selling pressure. Traders view sub-50 RSI during uptrends as potential buying opportunities.
More notably, the ADX at 22 remains below the trend confirmation level of 25, suggesting Ethereum is consolidating rather than trending. This low ADX reading after a strong move typically indicates accumulation before the next leg higher, particularly when price holds above key moving averages.
Both the 50-day EMA ($2,480) and 200-day EMA ($2,093) frame the current price action. Current price action is trading around $2,245, far below the 20/50 EMA cluster near $2,480–$2,525. The fact that ETH bounced precisely off the 200-day EMA shows this long-term moving average acted as a magnet for buyers. It’s worth noting that institutional algorithms often target these levels.
Key Levels:
- Immediate support: $2,200 (50-week EMA)
- Strong support: $1,800 (200-week EMA)
- Immediate resistance: $2,600 (recent rejection zone)
- Strong resistance: $3,000 (psychological level)
SPX6900: Meme momentum building
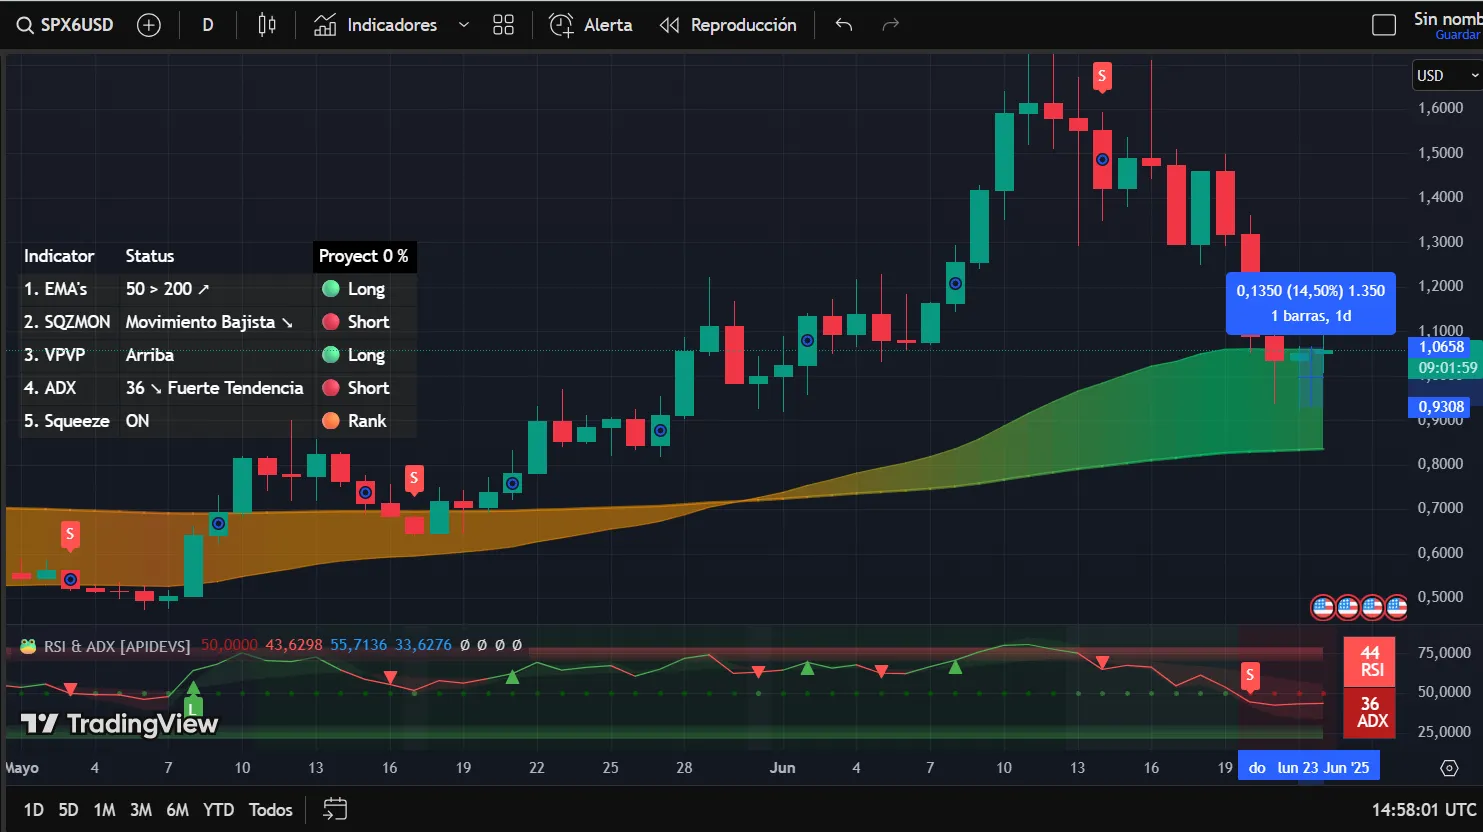
The 24-hour chart for the meme coin SPX6900 exploded with a double digit gain to $1.35 before correcting to its current $1.35. That’s enough for a 14.5% spike since yesterday’s dip, showcasing the raw power of meme coin momentum when conditions align.
The RSI at 44 might seem bearish at first glance, but context is key. After a violent selloff, this recovery from oversold conditions (below 30) represents a momentum shift. In other words, yes, people are selling a lot, but not as much as a few days before, which means there are less sellers in play and a recovery could be starting.
However, the ADX at 36 signals a strong trending environment. Readings above 25 confirm trend strength, while above 35 indicates powerful directional movement. This is typical of volatile meme coins that trend hard in both directions. The bearish trend is still in play, but the lower ADX in comparison to previous days may signal exhaustion from bears.
Price action shows that bears were able to put prices below the EMA50 (the average of the last 50 days) but the momentum only lasted a few days and the price is recovering. The successful defense of sub-$1.00 levels prevented a deeper correction and attracted fresh buying interest, and rejected the scenario of a potential death cross in the near future. So, you can breathe for now—whatever that means for meme coin traders.
Key Levels:
- Immediate support: $1.10 (breakout retest level)
- Strong support: $0.93 (recent bounce zone)
- Immediate resistance: $1.50 (round number resistance)
- Strong resistance: $1.77 (all-time high)
Fartcoin: Technical bounce meets whale interest
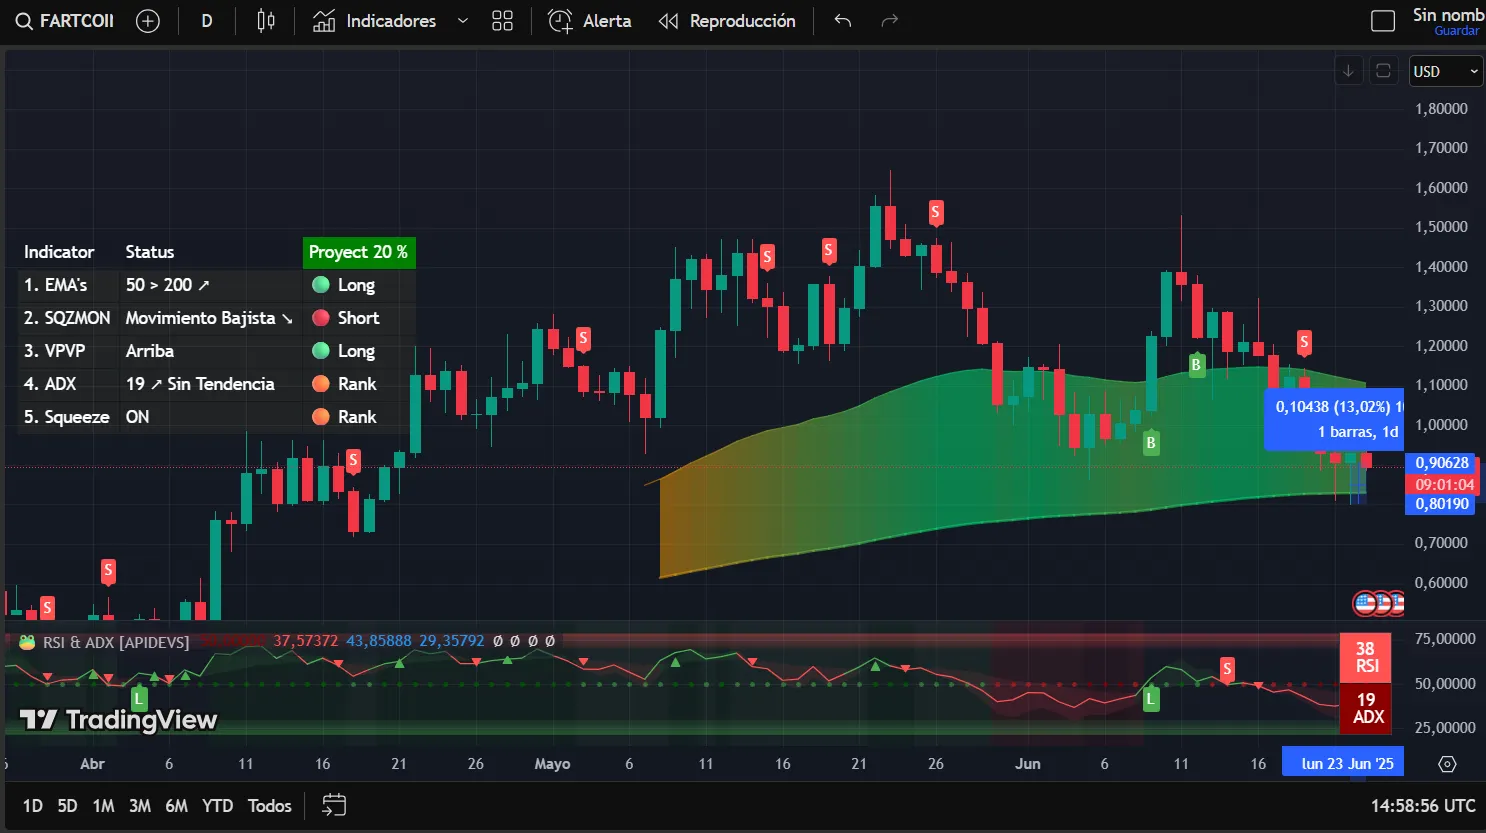
Despite its correction, Fartcoin is showing remarkable strength with a 13% surge from yesterday’s low to $1.10, driven by a combination of technical factors and on-chain dynamics that suggest more upside ahead.
The RSI at 38 shows a sharp recovery from oversold conditions. This is still bear territory, but shows momentum improving from extreme lows without yet reaching neutral (50). This could be a sort of a “sweet spot” where risk/reward favors longs—the selling has exhausted while buying interest returns. For even more copium, the coin also hasn’t dropped below the average price of the last 200 days.
The ADX at 19 sits below the 25 trend threshold. This low reading after a sharp decline often marks accumulation zones where smart money positions before the next trending move. Combined with the price bounce, it suggests a trend reversal could be developing but is not yet confirmed.
The successful bounce from $0.90 support demonstrates buying interest at key technical levels known as “Fibonacci levels,” These are basically natural price zones that form between the lowest and highest point of a price movement. So, in other words, bears are struggling to take prices below that zone.
Key Levels:
- Immediate support: $0.95 (psychological level)
- Strong support: $0.90 (78.6% Fibonacci/proven bounce zone)
- Immediate resistance: $1.10 (EMA50)
- Strong resistance: $1.3-1.4 (major resistance cluster)
Disclaimer
The views and opinions expressed by the author are for informational purposes only and do not constitute financial, investment, or other advice.
Daily Debrief Newsletter
Start every day with the top news stories right now, plus original features, a podcast, videos and more.