
In brief
- Bitcoin surged to a new all-time high after breaking through strong resistance levels.
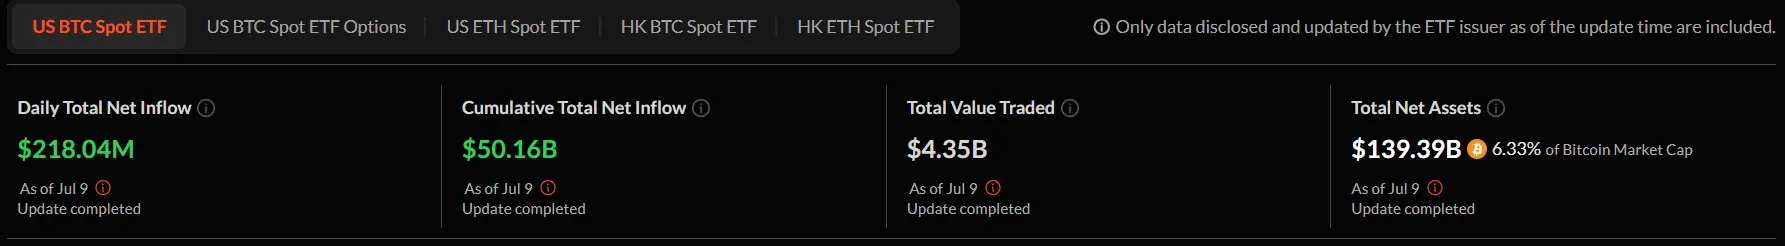
- Bitcoin ETFs continue to absorb selling pressure, acting as a determined catalyst for upward momentum.
- Technical indicators suggest BTC still has more room to run, even in the short term.
Bitcoin, the crypto market’s flagship asset, is painting a compelling breakout story, decisively conquering two major trading barriers that were standing in the way of a short-term bull run. And with BTC once again breaking price records and firmly above the $112,000 resistance level, what should traders expect next?
First, some context: With the S&P 500 and Nasdaq Composite closing at record highs for the third time in four sessions and gold futures trading at $3,370 an ounce, risk assets across the board are catching a bid as the Federal Reserve maintains its patient stance on monetary policy.
Bitcoin’s momentum also coincides with blowout U.S. jobs data, with non-farm payrolls growing 147,000 in June versus forecasts of 110,000. While strong employment data initially sent Bitcoin below $109,000 on rate hike fears, the market quickly absorbed the selling and pushed to new local highs.
Institutional adoption continues as the primary narrative driver. July has already seen Bitcoin ETFs pushing cumulative flows to over $50 billion. This persistent institutional bid provides crucial support during any pullbacks and validates Bitcoin’s evolution from speculative asset to portfolio allocation.
The convergence of technical breakouts and institutional accumulation has traders wondering what comes next as Bitcoin has seemingly now crossed the final hurdle on its path into uncharted territory.
Bitcoin charts: Double breakout targets final resistance
Bitcoin’s surge to $113K marks new all-time high territory and is a decisive technical breakout from two constraining patterns that have capped price action for weeks.
The 4-hour chart reveals a clean break above a symmetrical triangle formation, while the daily timeframe shows less bullish momentum with smaller movements.
This is expected in this kind of pattern, but such a long candlestick leaves little room for doubt. The breakout confirmation is clear—enough to turn almost all the key indicators to bullish in intraday timeframes.
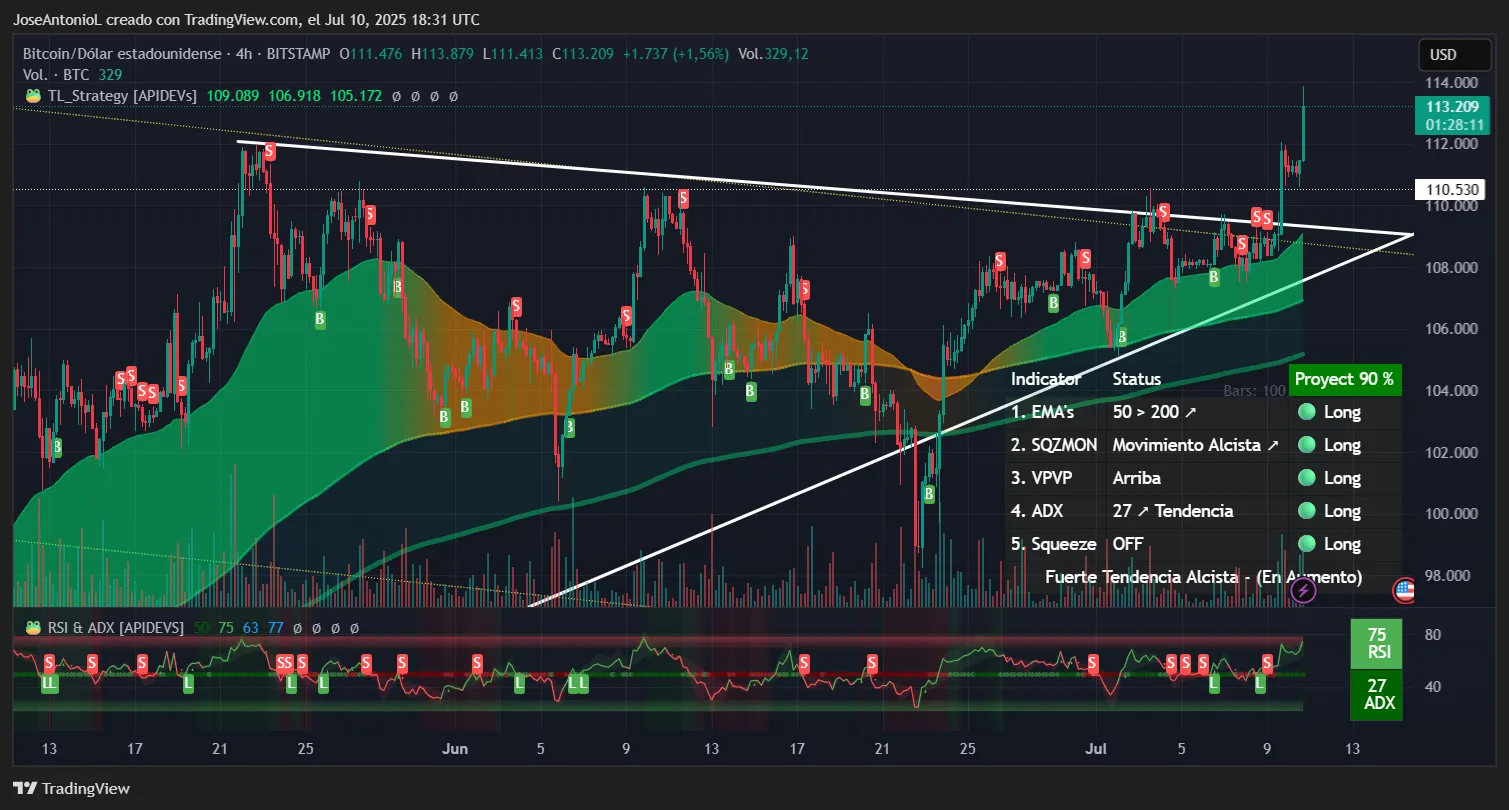
On the four-hour charts, the Average Directional Index, or ADX, is at 27. This typically confirms a trending market. ADX measures trend strength, regardless of direction, and when it crosses above 25, it signals to momentum traders that a sustainable trend is forming, often triggering systematic buying from trend-following strategies.
However, the Relative Strength Index, or RSI, at 75 shows Bitcoin in overbought territory. Think of RSI as temperature gauge of the market. When it gets too hot, it signals to traders that it may headed for a cool down. In this case, it could point to a need for a correction sometime soon after such a big spike. That said, Bitcoin has seen higher RSI levels while keeping its bullish momentum.
The Squeeze Momentum indicator on the daily chart shows “off” status, indicating volatility has already been released from the recent compression—as expected from prior analysis. This suggests the initial breakout move has played out, and traders should prepare for either continuation or consolidation at these levels.
Overall, prices are showing bullish signals. Although a continuation of the bullish trend is likely, a correction would not seem dangerous for the trend as the correction candlesticks have closed with minor movements in general.
The daily chart also presents a bullish structure with several confirming signals with Bitcoin escaping a descending bearish channel that has contained prices since the May highs (the yellow lines on the chart above).
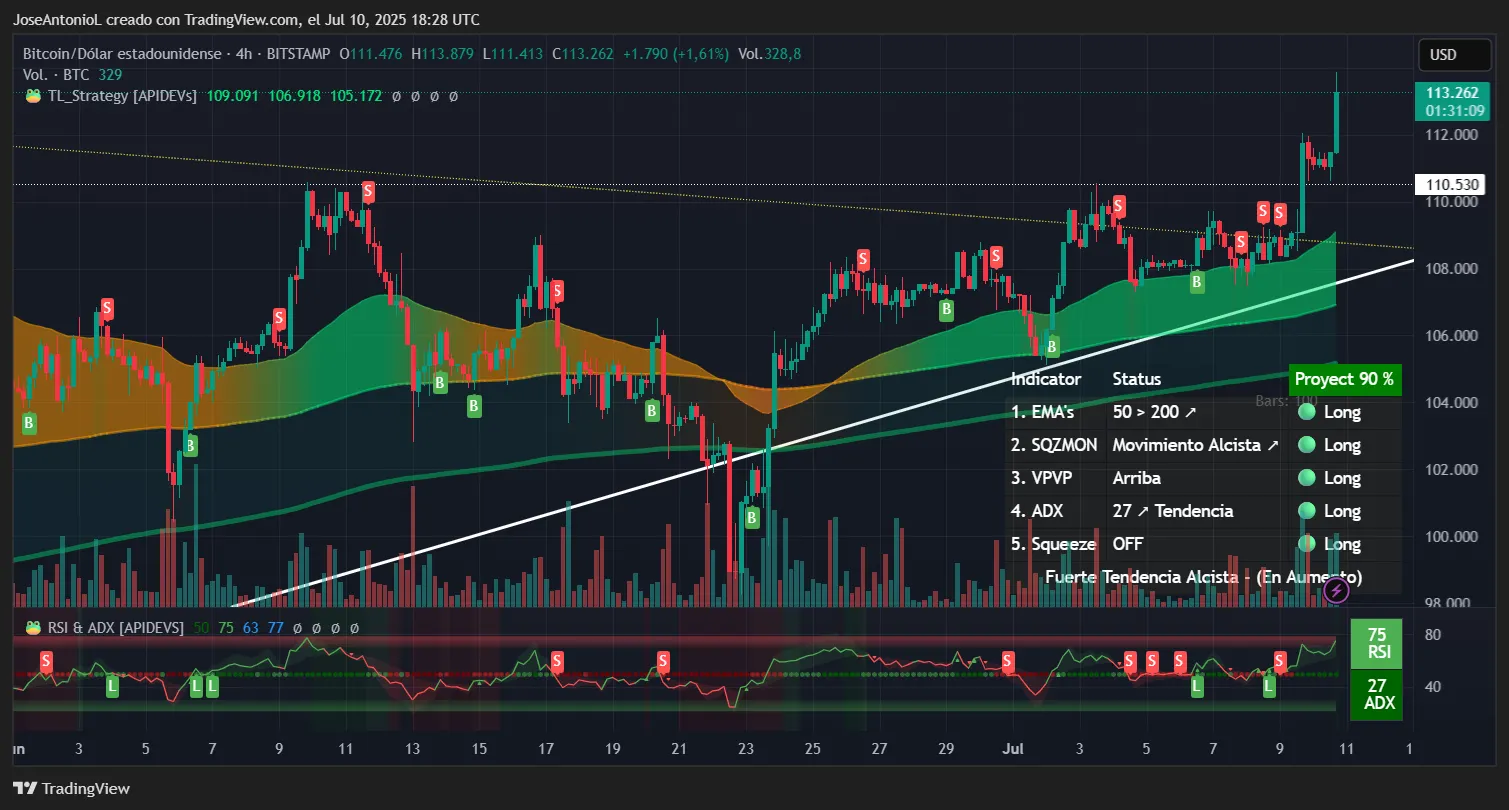
There now appears to be a bullish support in formation (the white line in the chart above) using the daily lows from April’s pullback and late June as reference points. If this is confirmed, Bitcoin could be bouncing around this support, maintaining its bullish momentum with 110K becoming a new support by the end of the month.
On the daily charts, the RSI at 67 indicates healthy momentum without approaching overbought territory above 70—suggesting room for further upside. This reading tells traders that buying pressure remains strong but hasn’t reached extreme levels that typically precede corrections.
The ADX at 12 on the daily chart shows the trend is still developing and there is still not enough dominance to call it a defined pattern as shorter term charts often contain a lot of noise. While below the crucial 25 threshold that confirms strong directional movement, this low reading after a breakout often indicates the calm before acceleration. Traders interpret this as accumulation before the next impulsive move higher.
Moving average analysis reveals Bitcoin trading well above both the 50-period and 200-period EMAs on multiple timeframes. The expanding gap between these averages—known as moving average divergence—typically indicates strong trending conditions and acts as dynamic support during pullbacks.
Key Levels:
- Immediate support: $110,197 (breakout retest level)
- Strong support: $105,000-$108,700 (Support line)
- Projected resistance: $115,000 (measured move target from triangle breakout and the Fibonacci extensions)
What’s next for Bitcoin?
The convergence of technical breakouts, institutional flows, and supportive macro conditions position Bitcoin for a potential continuation of the bullish trend past the all-time high resistance. However, traders with a proclivity for technical analysis should monitor the daily ADX for a move above 25 to confirm trend strength, while watching for any RSI divergences on failed attempts at new highs.
Traders on Myriad, a prediction market developed by Decrypt’s parent company Dastan, are decidedly bullish on the upward trend. Myriad users now place the odds of Bitcoin never dropping below $100K throughout the month of July at 81%. It’s a near-lock, at 90%, that Bitcoin holds above $109,000 by the end of week, with the odds rising by a whopping 40% overnight.
Likewise, Myriad users are now more certain than ever that BTC hits $115K well before it drops back down to $95K, the odds rising from 69% to 87% over the last day.
Zooming out, July could still prove volatile for Bitcoin, with Trump administration policies including the “Big Beautiful Bill” potentially widening the U.S. deficit by $3.3 trillion—historically bullish for scarce assets like BTC. Additionally, the July 22 deadline for the White House’s report on crypto executive orders, with potential updates on the U.S. Strategic Bitcoin Reserve, looms as a wildcard catalyst.
Disclaimer
The views and opinions expressed by the author are for informational purposes only and do not constitute financial, investment, or other advice.
Daily Debrief Newsletter
Start every day with the top news stories right now, plus original features, a podcast, videos and more.