
In brief
- Crypto market cap has rebounded above $3.7 trillion.
- Ethereum has broken above a key price resistance zone.
- XRP and Litecoin show double-digit weekly gains, and the charts are showing signs traders like to see.
After a rough weekend that saw cryptocurrencies plunge alongside global risk assets, the crypto market is staging an impressive recovery rally. The total market capitalization has climbed back to $3.76 trillion, up 2.01% from yesterday, with an overwhelming 95% of the top 100 cryptocurrencies posting gains in the past 24 hours.
The rebound comes as traditional markets find their footing, with the S&P 500 futures pointing to a positive open after Friday’s tariff-induced selloff. Wall Street weighed a tariff reprieve for Mexico, a new trade deal with South Korea, and strong earnings from Meta and Microsoft, helping ease investor concerns.
On Myriad Markets—a prediction platform developed by Decrypt’s parent company, Dastan—markets are clearly favoring the Nasdaq to outperform the S&P 500 in price performance tomorrow. While the Nasdaq is generally more volatile, it has recently delivered stronger returns, driven largely by the tech sector’s surge during the ongoing AI boom of the past few years.
Bitcoin, the crypto market’s bellwether, has managed a modest 1% gain to $114,798, providing a stable foundation for altcoins to build upon. However, the real action is happening further down the market cap rankings, with Mantle surging 19% to $0.83 and Memecore rocketing 26% to $0.55—the only two double-digit gainers among the top 100 coins.
Ethereum (ETH): Breaking through resistance
Ethereum is leading the crypto majors recovery with a 4.36% gain to $3,650, breaking above the $3,600 resistance level and apparently turning a resistance that had capped rallies since late July into a support.
On Myriad Markets, 60% of predictors expect the coin to hit a new all time high this yearr—and that may not be such a far-fetched idea given the current chart patterns. While a move of over 30% is no small feat, it’s a milestone that remains within reach over the next six months.
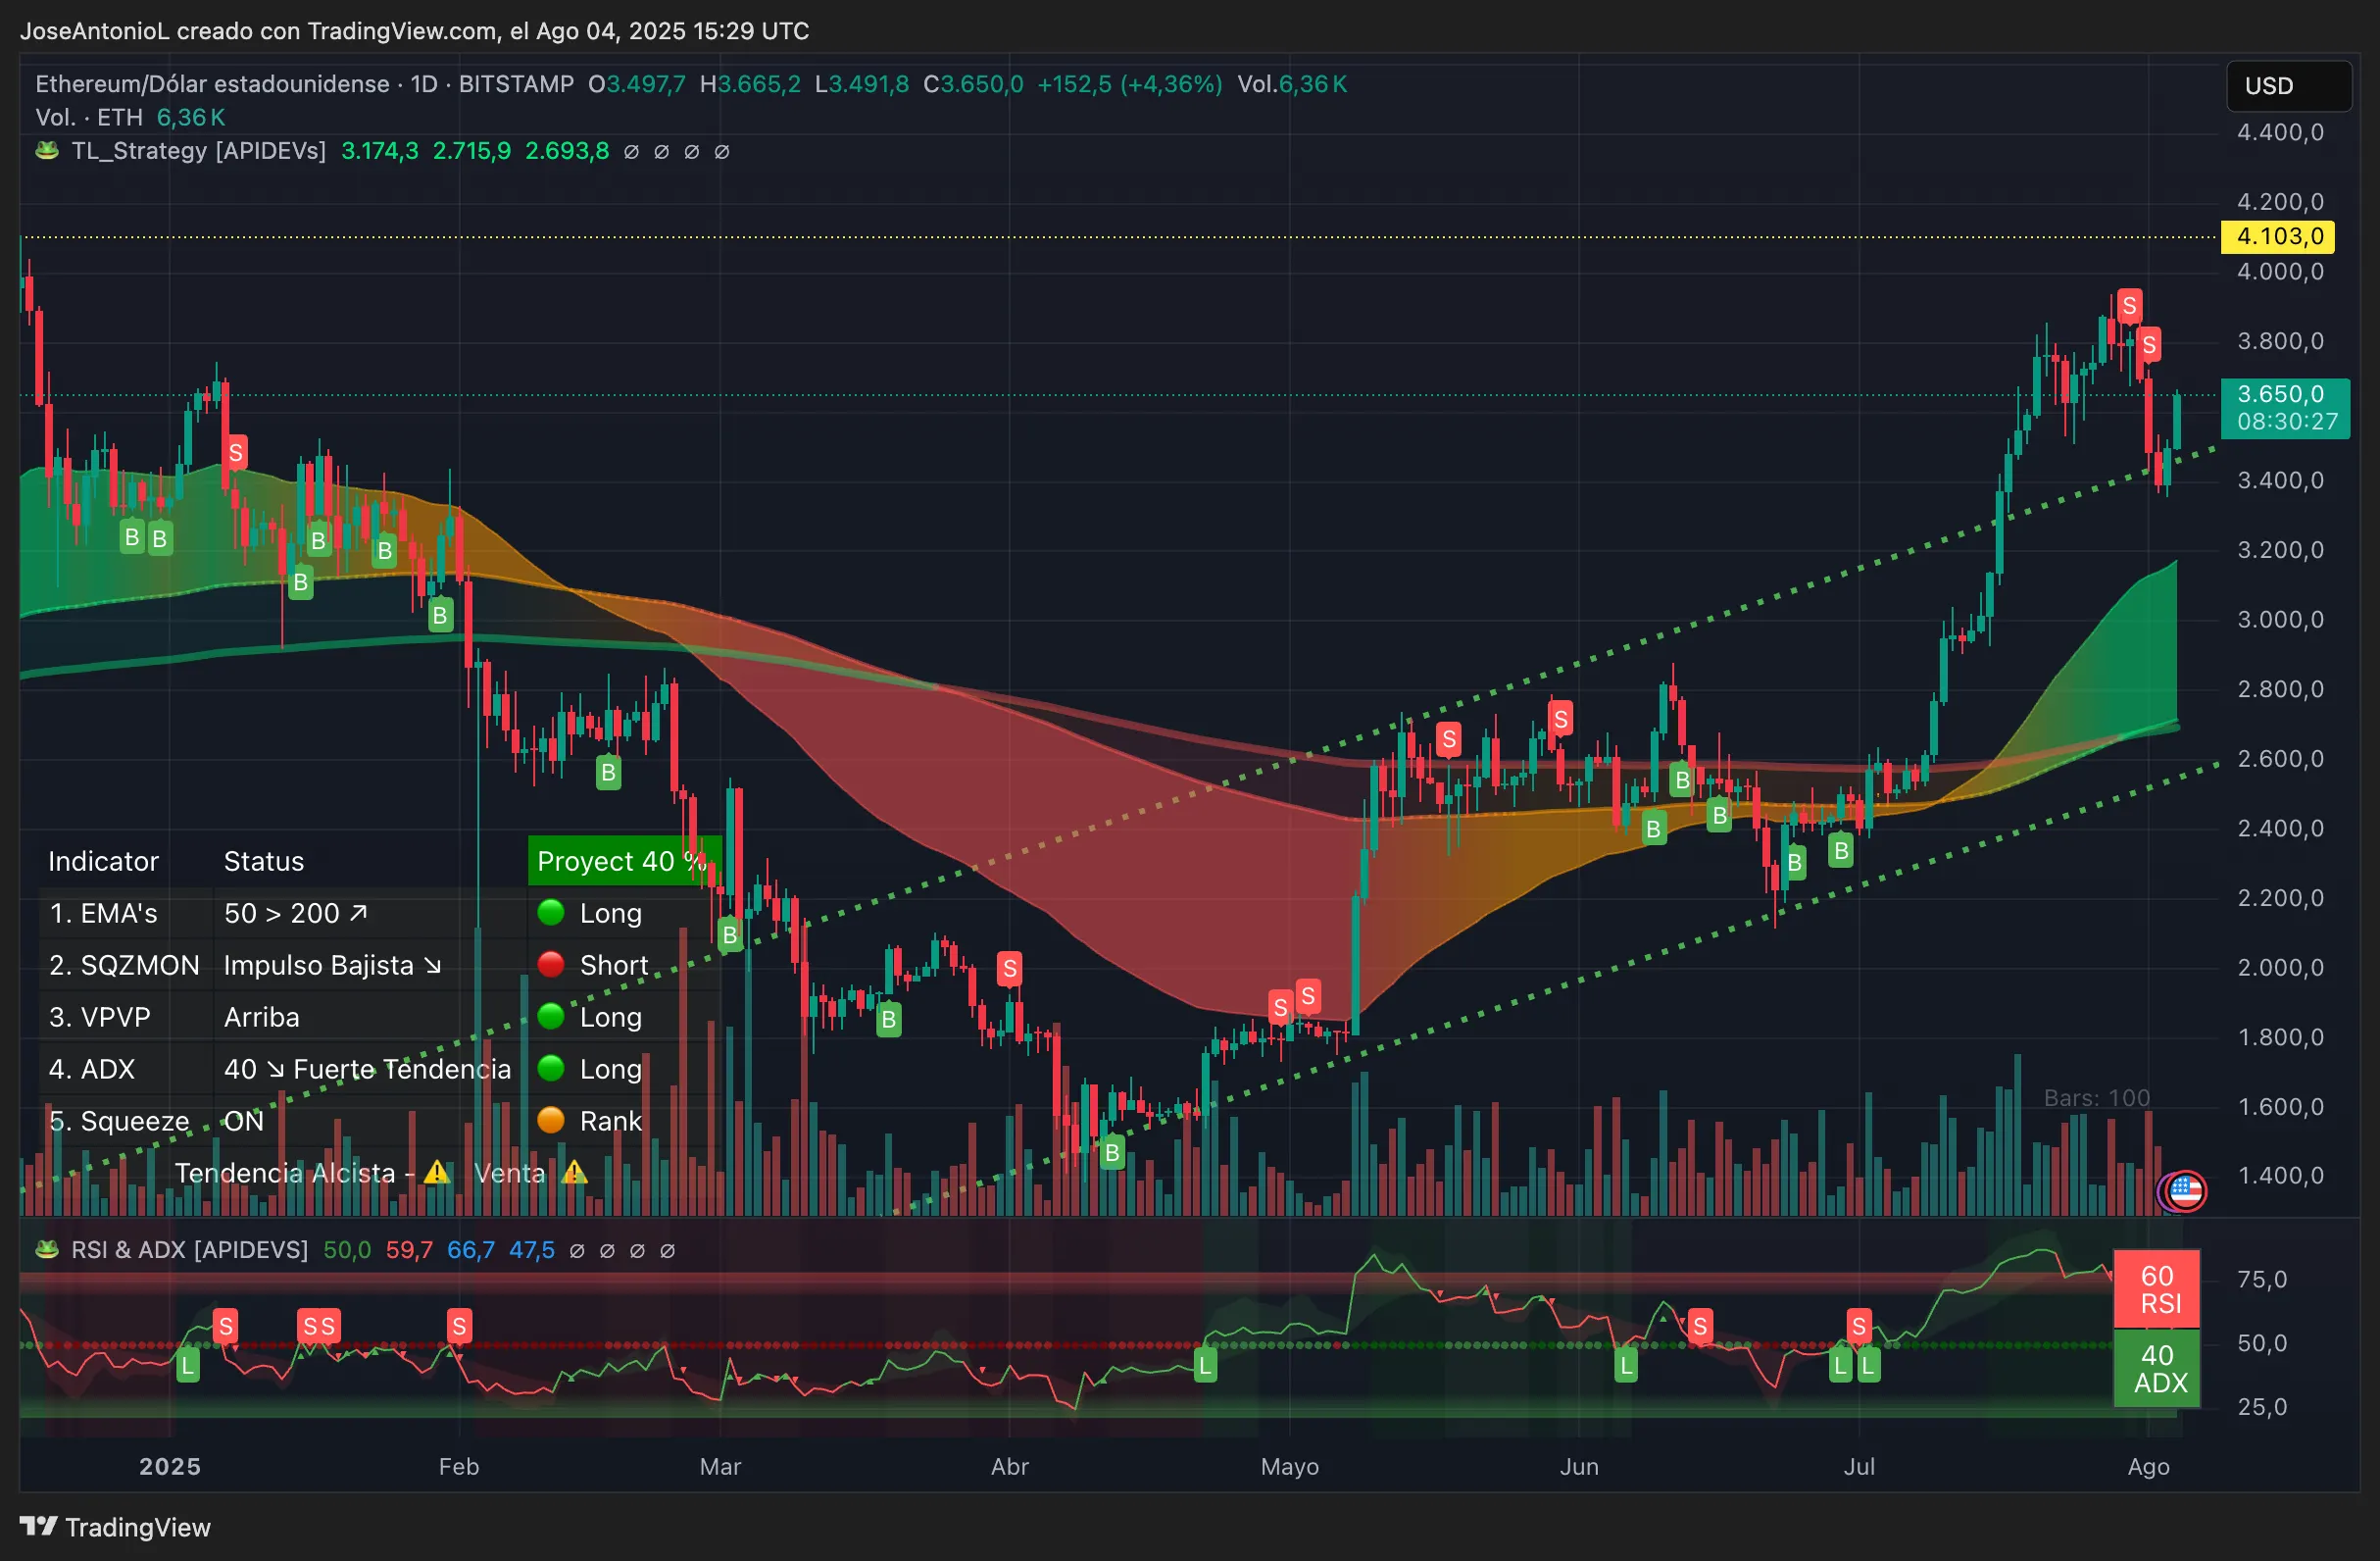
The technical picture for ETH seems mostly strong. Ethereum’s Exponential Moving Averages, an indicator that measures the average price of an asset over a given period of time, tell an interesting story: The 50-day EMA sits well below current prices, providing solid support around the $3,200 zone. Meanwhile, the 200-day EMA acts as a foundation near $2,700, creating multiple layers of support that traders typically view as bullish. When short-term averages trade above long-term ones, it signals sustained buying pressure.
In our chart above, the gap between both EMAs is filled with red or green to better signal bullish or bearish configurations.
The Average Directional Index, or ADX, measures trend strength on a scale of 0-100, where readings above 25 confirm a strong trend and above 40 indicate extremely powerful momentum. The ADX indicator at 40 suggests Ethereum’s uptrend has serious legs. Traders typically interpret such high ADX values as confirmation that the move isn’t just a temporary bounce but potentially the start of a more significant rally.
However, the Squeeze Momentum Indicator shows an “on” status, which is highly significant. This indicator identifies periods when volatility compresses (the squeeze) before explosive moves. When it fires “on,” it signals that a breakout from the consolidation phase is underway. Combined with the bullish price action, this suggests traders should prepare for increased volatility, likely to the upside given the current momentum. It’s the only indicator that points to a possible correction under formation—a theory that could only gain strength if the actual support near $3,400 is broken.
The Relative Strength Index, or RSI, measures momentum, with readings above 70 signaling overbought conditions where profit-taking often emerges. At 60, ETH has room to run before hitting levels that typically trigger selling pressure. Traders may interpret this as particularly bullish because it means the recent 4.36% gain hasn’t pushed the indicator into dangerous territory.
Key Levels:
- Immediate support: $3,600 (former resistance, now support)
- Strong support: $3,200 (psychological level, confirming the market’s rejection of $3,600 as a new support after its attempted shift from resistance.)
- Immediate resistance: $3,800 (July highs)
- Strong resistance: $4,103 (major Fibonacci extension)
XRP: Institutional interest drives momentum
XRP continues its rebirth from the ashes with a 2.83% gain to $3.04, maintaining its position above the psychologically important $3.00 level. The Ripple-linked cryptocurrency has been one of 2025’s standout performers, driven by growing speculation about a spot XRP ETF and regulatory clarity following the SEC lawsuit resolution.
On Myriad Markets, predictors expect to see an XRP ETF sooner than a Litecoin one, even if the expectations are increasing for both coins.
Generally speaking, traders see spot crypto ETFs with optimistic eyes, as they may inject liquidity, increasing the price appreciation of the underlying cryptocurrencies involved.
The technical setup for XRP reads like a market in transition. The ADX at 34 confirms a strong trending environment. Readings above 25 indicate trend establishment, and at 34, we’re seeing confirmed directional movement that traders rely on for trend-following strategies. However, the strong correction from its recent all-time high means that traders must not expect overly accelerated movements (at least to the upside).
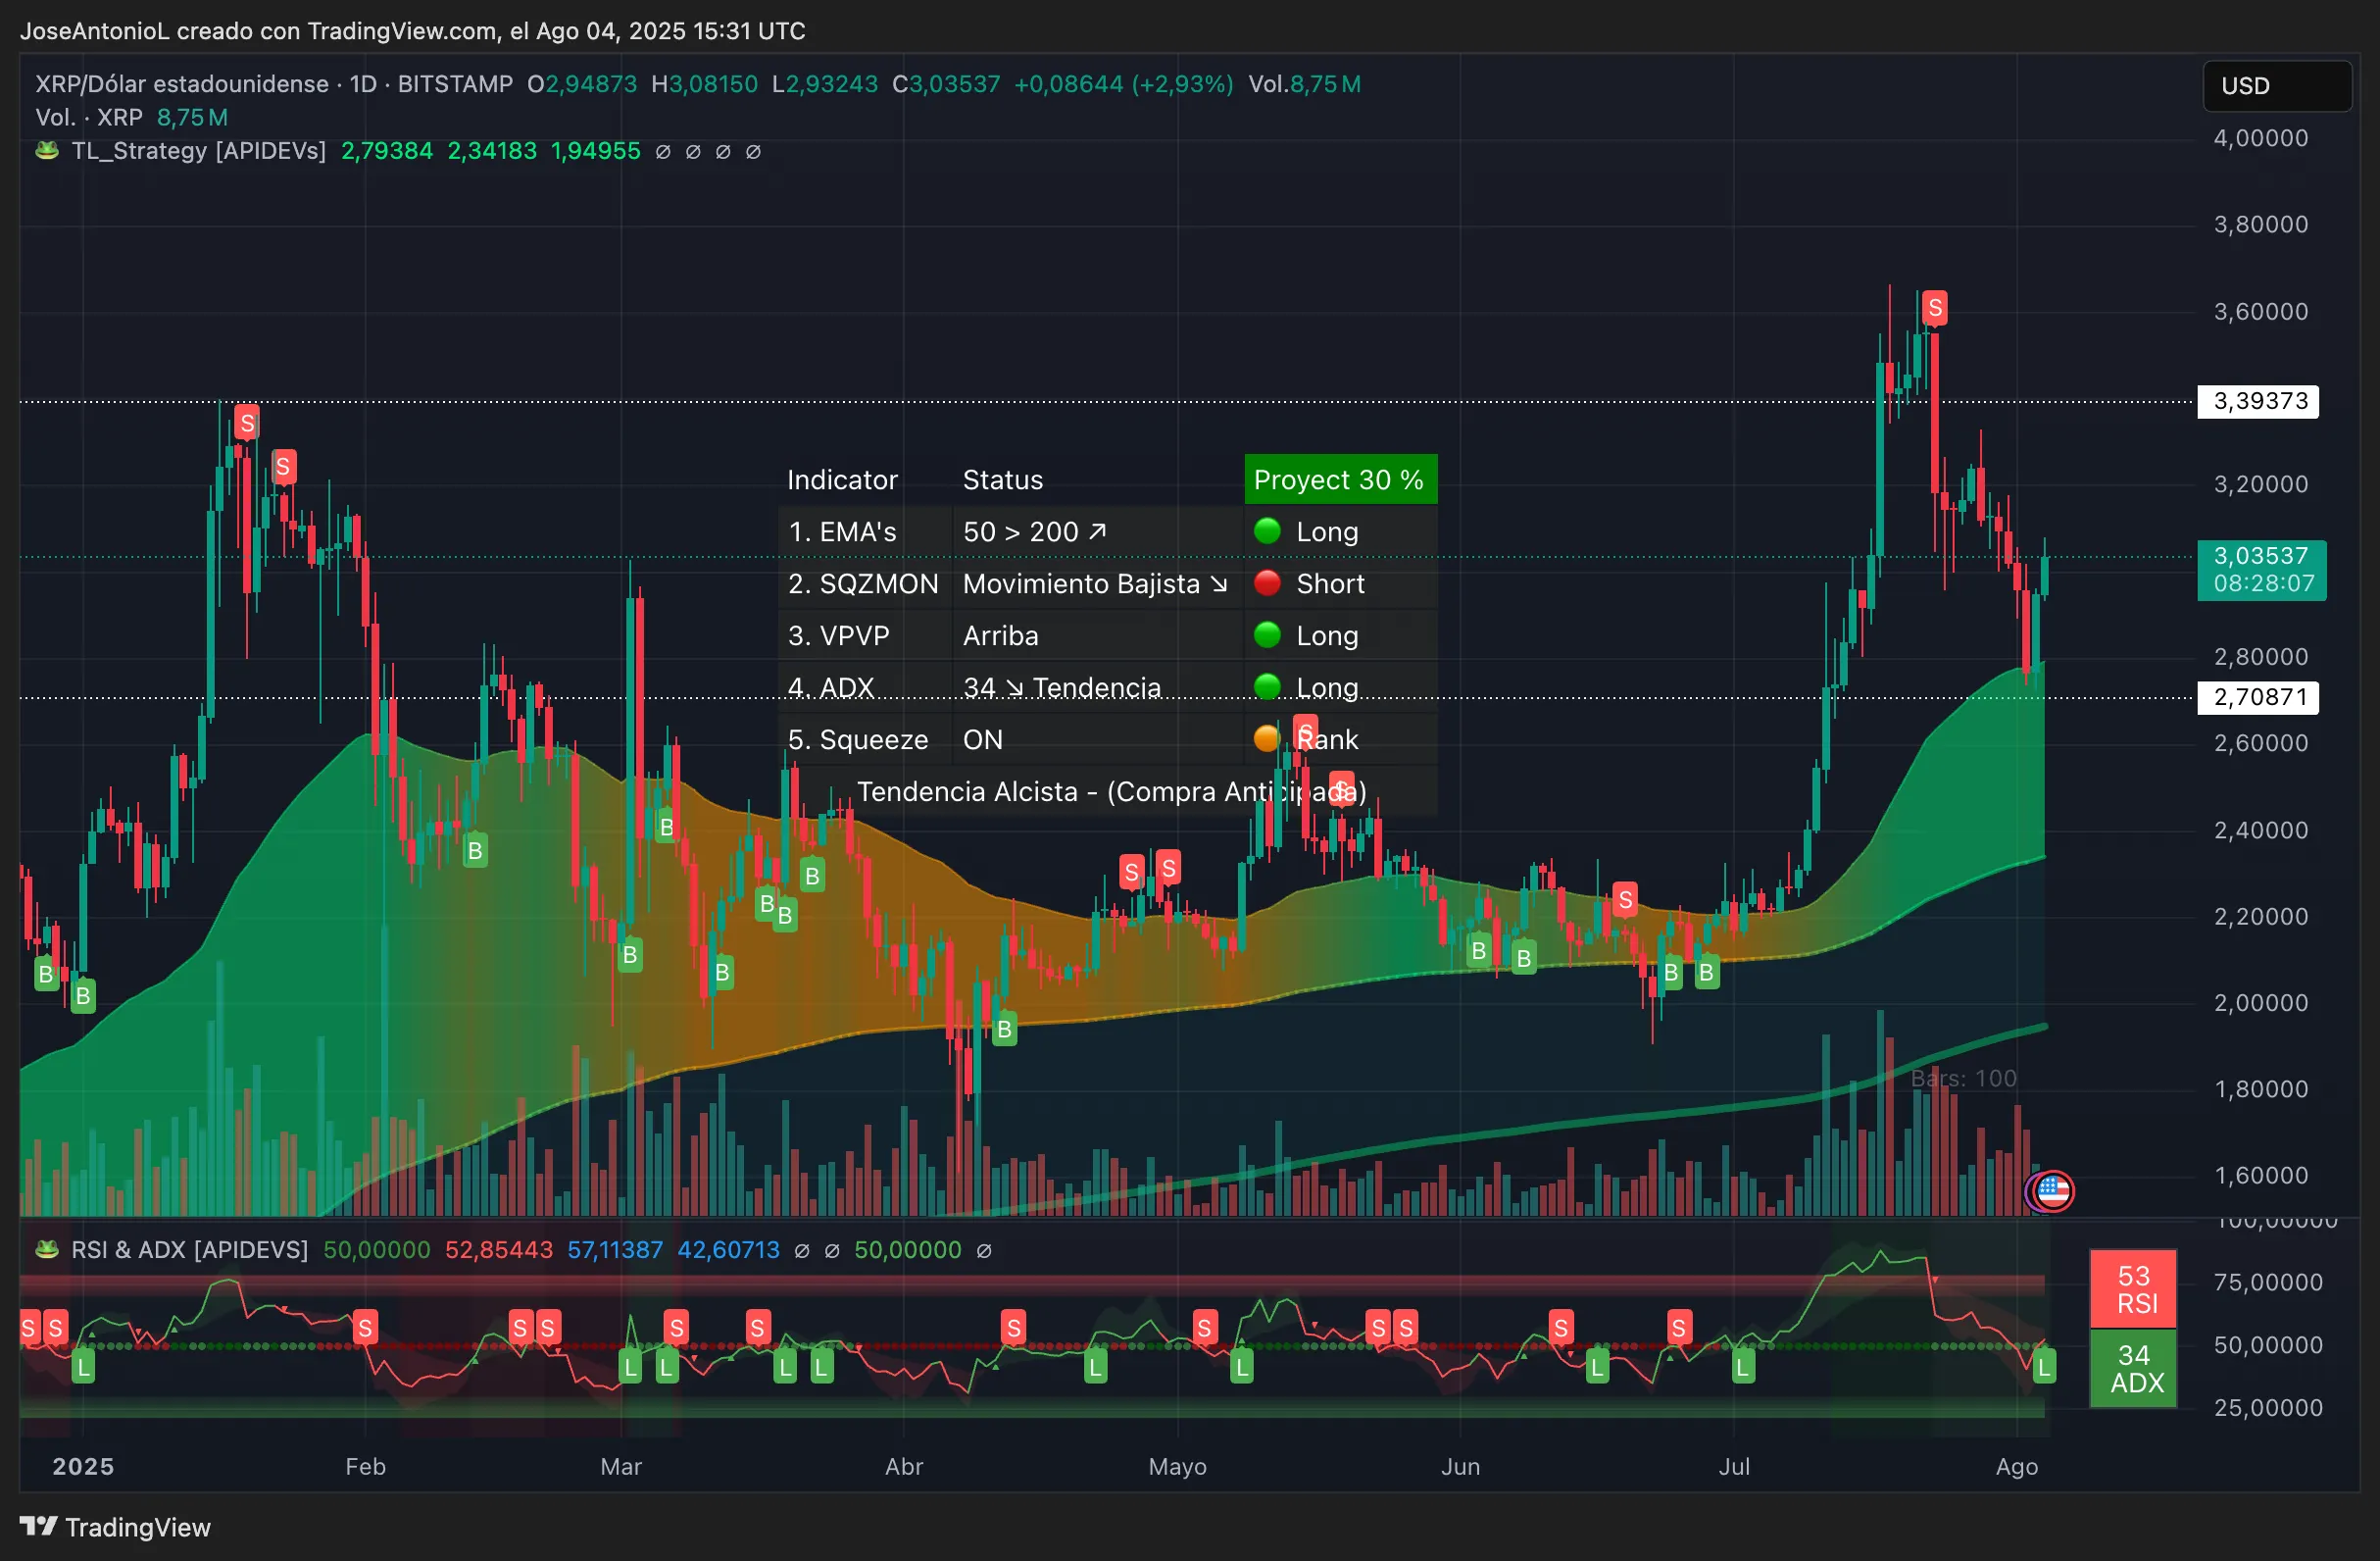
The 50-200 EMA configuration is also one traders would interpret as a bullish sign despite the recent correction. The fact that price trades above both averages is bullish, indicating buyers are in control across multiple timeframes.
RSI at 53 also seems neutral, but this is actually good. After XRP’s massive rally from $2.00 to $3.70, this middling RSI reading actually represents healthy consolidation. It shows the market has digested gains without becoming oversold—a sign of strength that suggests accumulation rather than distribution.
The Squeeze Momentum Indicator status confirms what the price action suggests. The tip from $3.30 to $3.00 seems like a price correction. Short term traders may be inclined to keep an eye on the movements and set stop loss orders nearby. But the bullish configuration remains in play.
Key Levels:
- Immediate support: $2.95 (intraday low)
- Strong support: $2.71 (200-day EMA zone)
- Immediate resistance: $3.39 (recent rejection level)
- Strong resistance: $3.70 (August highs)
Litecoin (LTC): Digital Silver Shines Bright
Litecoin rounds out the major cryptocurrency recovery with an 8.72% surge to $119.11, significantly outperforming both Bitcoin and Ethereum. The “digital silver” narrative appears to be gaining traction as LTC benefits from renewed institutional interest and ETF speculation, with analysts almost certain an ETF will be approved sooner than later.
Trying to figure out what could go into an SEC framework aside from CFTC approved futures we looked at a few potential data points. The entire note and our midyear outlook can be seen at this link for Bloomberg Terminal clients: pic.twitter.com/Y9CcCdNAGF
— James Seyffart (@JSeyff) June 30, 2025
The technical indicators for Litecoin paint an overwhelmingly bullish picture. The ADX at 23 is approaching the crucial 25 threshold. Traders watch this level closely as it often marks the transition from choppy, directionless trading to sustained trending behavior. With ADX rising toward this level, it suggests Litecoin’s recent strength could evolve into a more persistent uptrend.
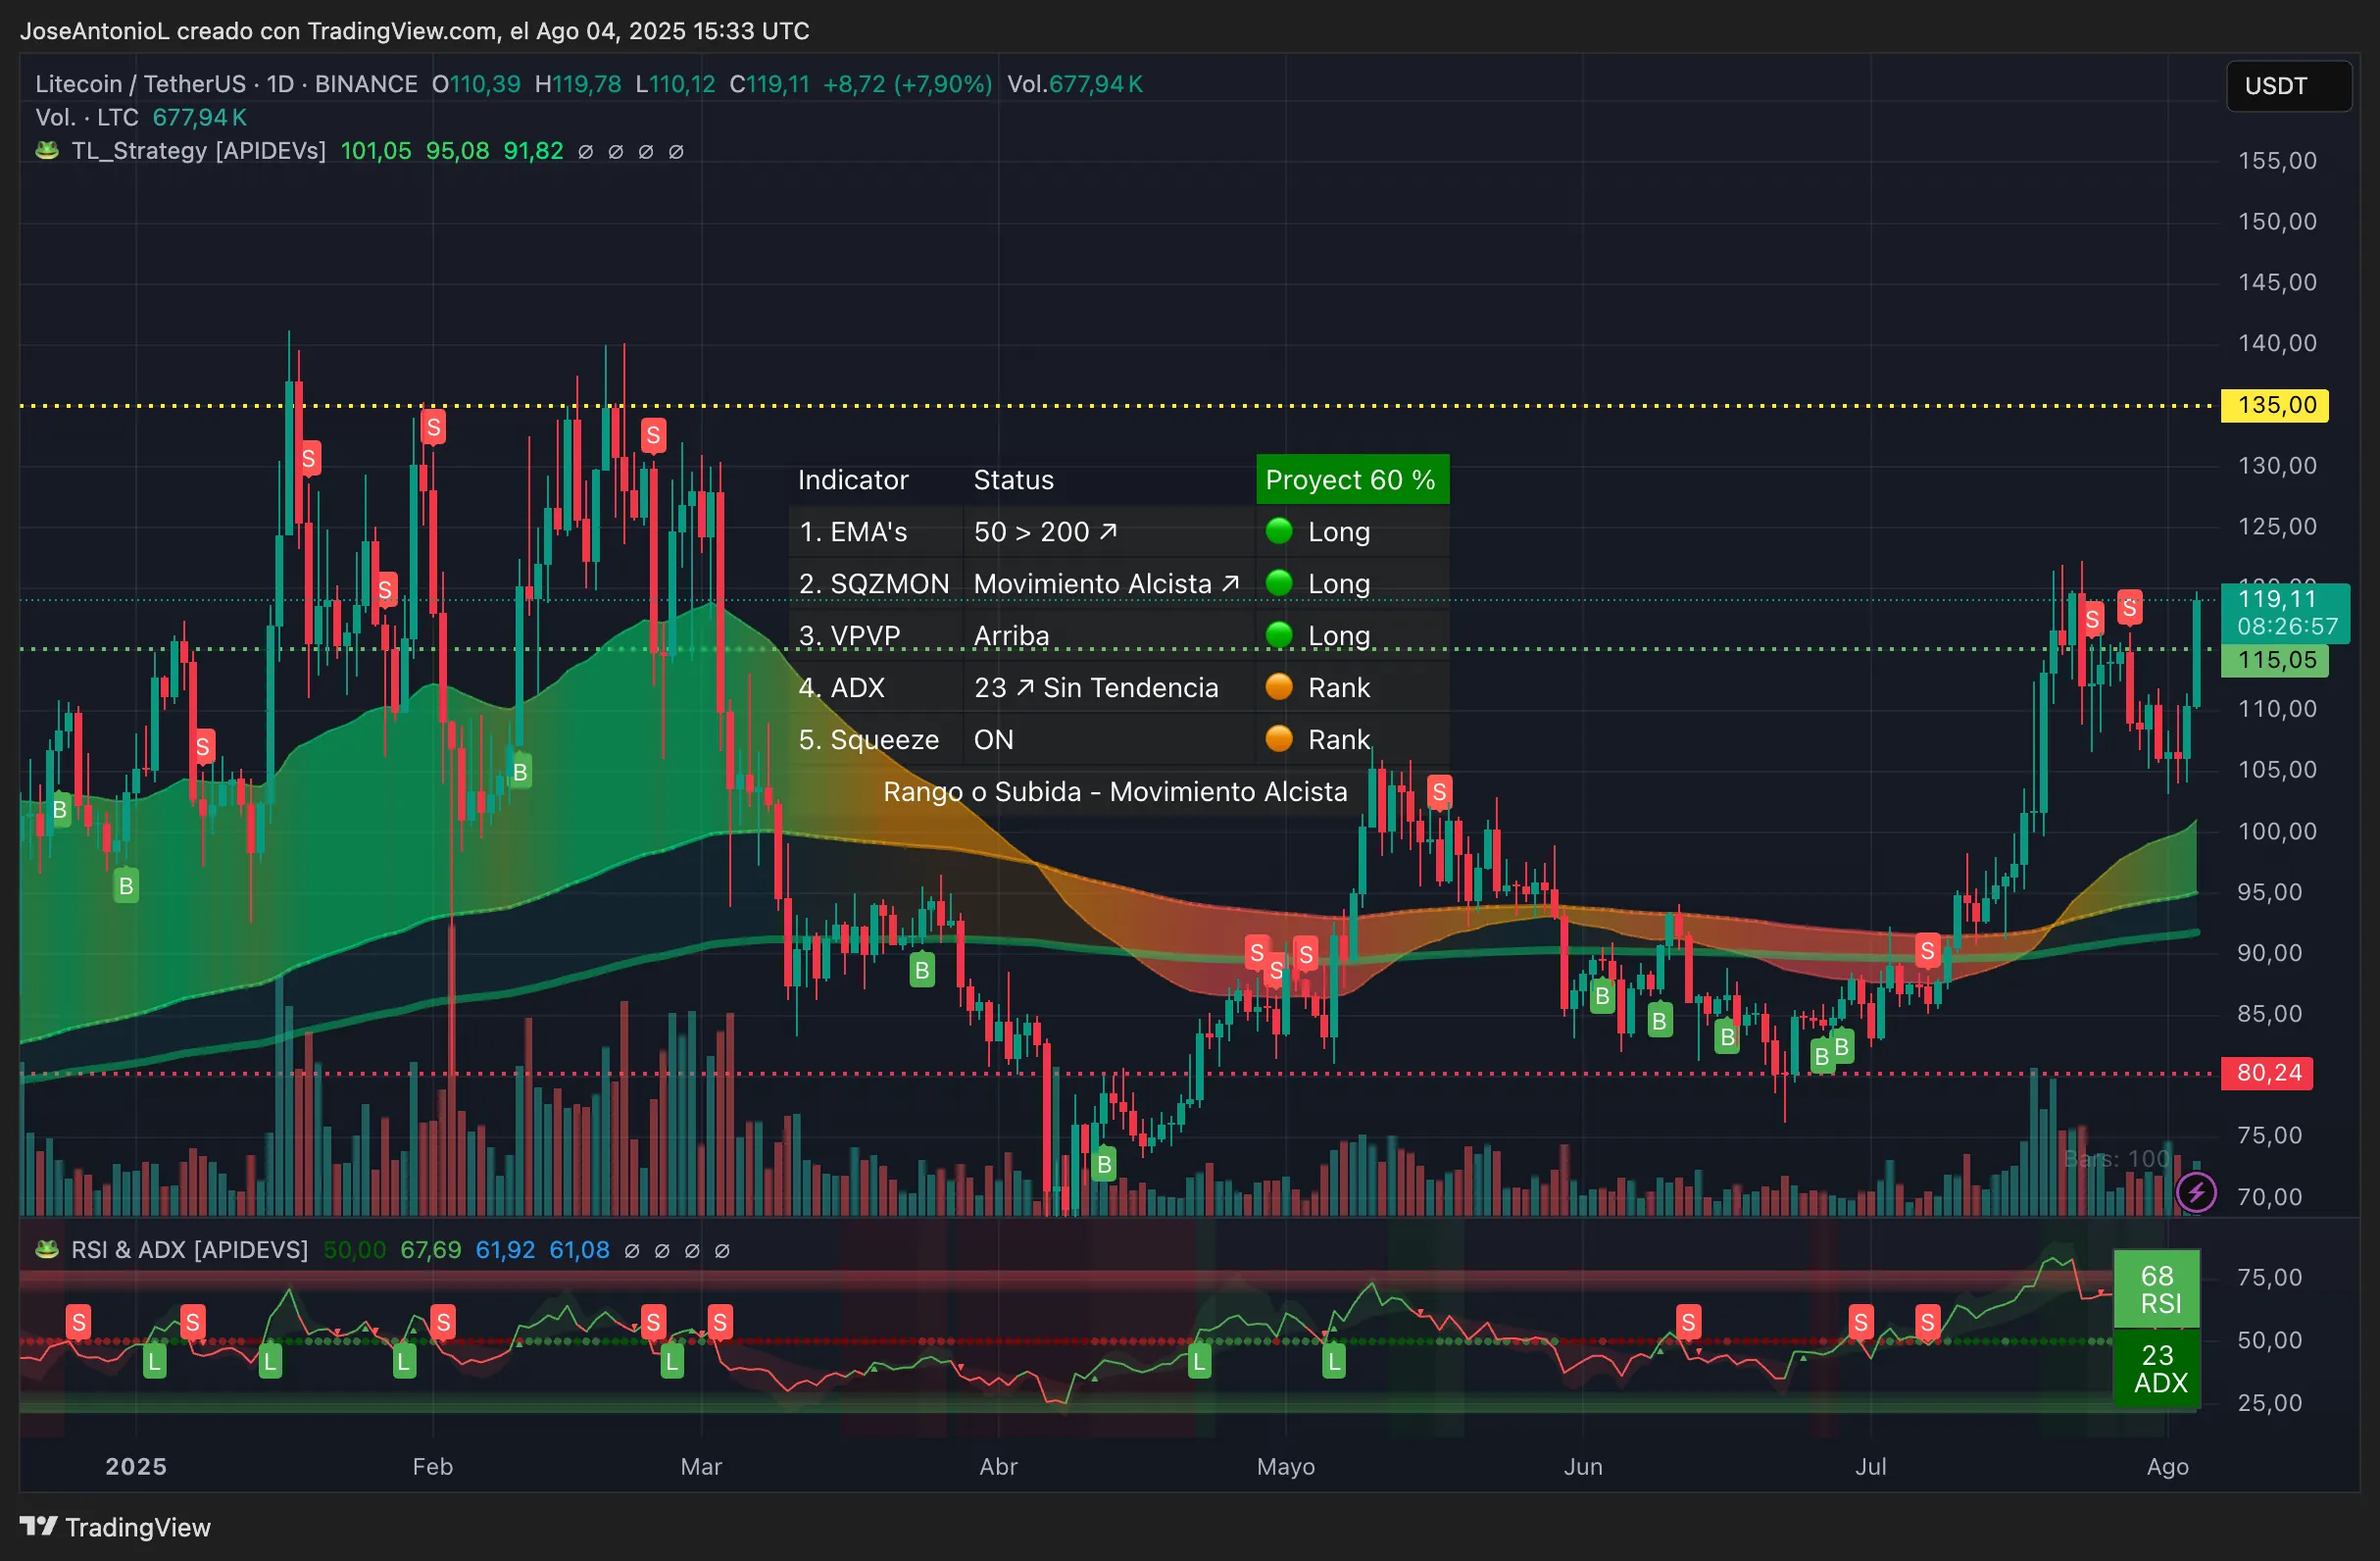
The EMA spread deserves special attention. Litecoin recently broke past its bearish configuration and crossed into a golden cross zone, which provides more momentum to the bullish thesis.
With the 50-day EMA providing support around $110 and the 200-day EMA further below, Litecoin enjoys what traders call a “bullish stack”— each moving average acts as a potential support level during pullbacks.
RSI at 68 is flirting with overbought territory (above 70) but hasn’t quite reached it. This shows strong buying pressure without triggering automatic selling from algorithmic trading systems that often kick in above 70. Historical data shows Litecoin can sustain RSI readings between 65-75 for extended periods during bull runs, suggesting more upside is possible.
The Squeeze Momentum Indicator’s status aligns perfectly with the price breakout above $115. This indicator excels at identifying when markets transition from consolidation to trending phases. This statistic alone suggests prices may keep trading near the $120 price line, as price compression remains in play before an explosive movement, slowing the movement, but respecting its direction.
Key Levels:
- Immediate support: $110 (breakout level)
- Strong support: $100.00 (psychological level and 50-day EMA)
- Immediate resistance: $135.00 (zone around yearly highs)
- Strong resistance: $150.00 (major psychological target)
Disclaimer
The views and opinions expressed by the author are for informational purposes only and do not constitute financial, investment, or other advice.
Daily Debrief Newsletter
Start every day with the top news stories right now, plus original features, a podcast, videos and more.