
In brief
- Crypto markets are in correction mode, as PPI throws cold water on the rally.
- But Cardano traders had other ideas today. ADA pumped while XRP, BTC, and ETH dumped.
- Here’s why, and what the charts suggest may happen next.
Crypto volatility is back. But while most of the majors are pulling back, with Bitcoin leading the way, there’s one coin going off-script: Charles Hoskinson’s Cardano, believe it or not.
It’s been this way for a while now, but in case it wasn’t obvious, Bitcoin is much more sensitive to macro winds these days than it was pre-COVID. And that’s only going to become increasingly the case as big banks and large Wall Street funds enter the crypto market.
July’s Producer Price Index, or PPI as it’s more generally termed, surged 0.9% month-over-month and 3.3% year-over-year, both well above forecasts. Why do investors care? PPI is a widely cited measure of inflation. And coming in hotter than expected has reduced expectations for sizable, near-term Fed rate cuts. On Myriad, a prediction market developed by Decrypt‘s parent company Dastan, the odds for any change at all to federal interest rates next month dropped by 7% today.
Rate cuts and cheap money generally mean more liquidity in risk assets, which in turn generally bodes well for crypto. The inflation bombshell, therefore, negatively impacted risk assets, with the total crypto market cap plummeting 3.01% to $3.99 trillion. Bitcoin lost 3.9%, Ethereum shed 3.3%, and XRP dipped a painful 6%.
But not Cardano. The coin, which trades as ADA, rocketed 3.59% today to $0.909, making it the third-best performing token in the top 100 by market cap. The Cardano price pump might have a little something to do with the crypto fund Grayscale and rumors of a forthcoming ADA ETF. A “Grayscale Cardano Trust ETF” registration hit the Delaware state website on Tuesday.
If it happens, it could greatly increase liquidity and exposure to Cardano in the future, which no doubt would be welcomed news to the ADA faithful.
Cardano (ADA) price: ETF euphoria
So what do the charts have to say about Cardano?
ADA’s trend-defying 3.59% surge to $0.909 comes as news of the filing, which can be found on Delaware’s state website, spread across social media. Nothing like good, old-fashioned FOMO.
It’s worth noting, however, that Grayscale has yet to publicly comment on the filing, and it wouldn’t be the first time someone has faked an ETF filing on Delaware’s website. So, for now, best to take it all with a grain of salt.
Nevertheless, the Cardano ETF euphoria has been met with exploding trading volumes for ADA, and the price of the coin briefly breaking past a heavy resistance zone that has held up throughout the year.
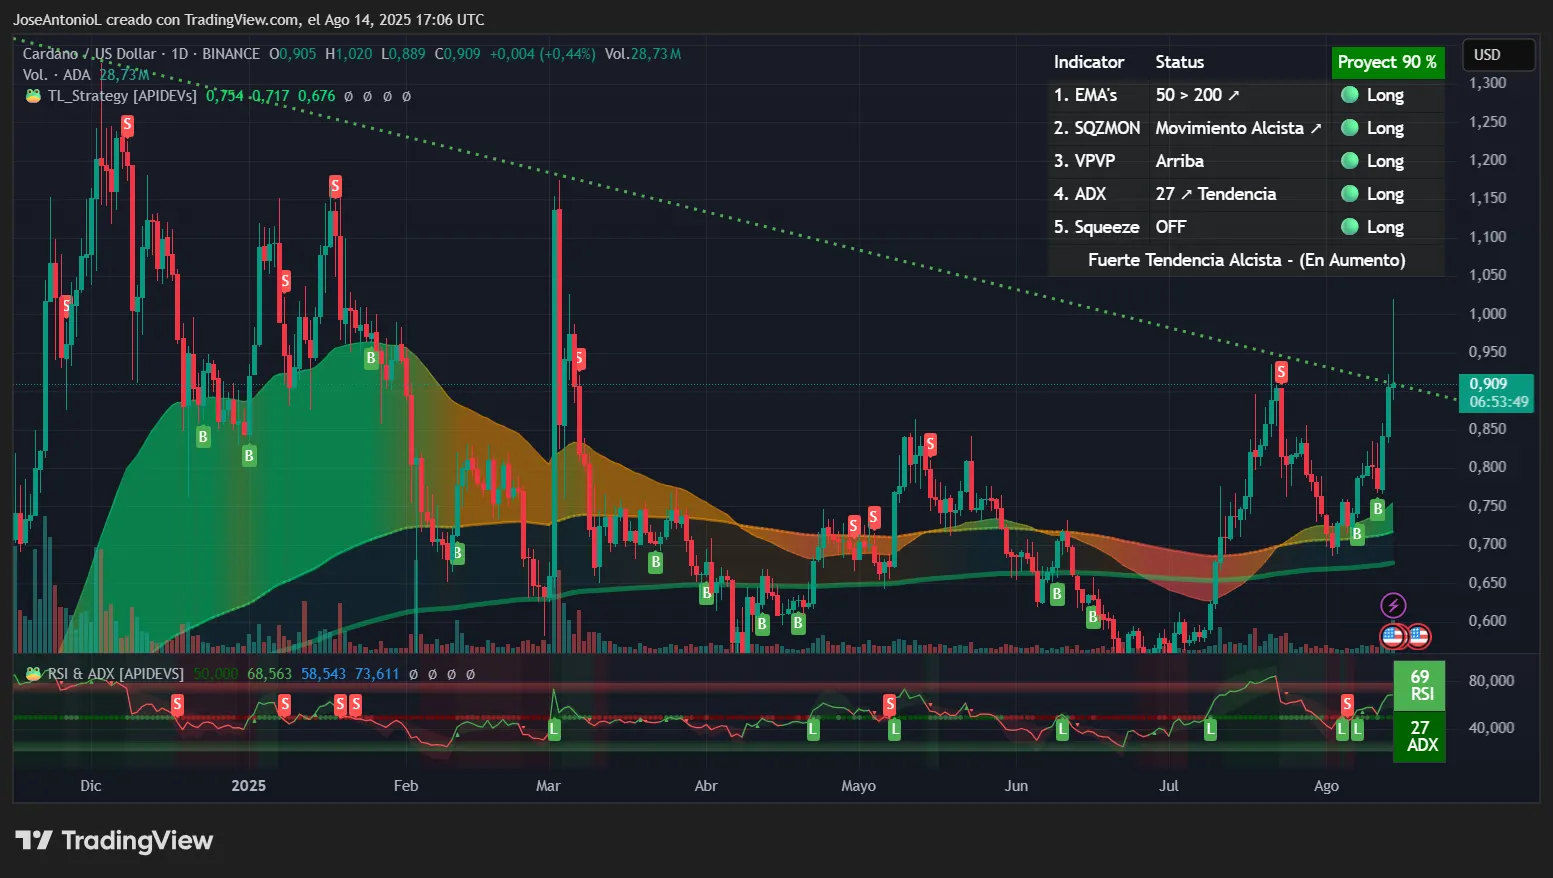
At the moment, the technical picture for ADA shows strong bullish momentum, though caution flags are starting to wave.
The Relative Strength Index, or RSI, for Cardano is at 69, flirting with overbought territory above 70. This would suggest to traders that ADA is running hot but hasn’t quite hit the danger zone where profit-taking typically kicks in. Think of RSI as a speedometer for price momentum. At 69, we’re speeding but not quite redlining the engine.
Such a boost could be exactly what markets need to break past resistance. Even if things cool down, it creates conditions that might make it easier for bulls to push prices up.
Cardano’s Average Directional Index, or ADX, is at 27, which tells an even more compelling story. ADX measures trend strength on a scale from 0 to 100, and anything above 25 confirms a solid trend is in place. At 27, ADA has crossed into established-trend territory. This usually indicates that whatever direction the price is moving has real legs behind it, not just temporary noise.
When ADX rises above 25 after a period below it, traders interpret this as the market transitioning from choppy, directionless action to sustained trending behavior.
The EMA configuration adds another layer of bullish confirmation. Exponential moving averages, or EMAs, measure average prices over set periods of time. With the 50-day EMA sitting well above the 200-day EMA, the coin recently entered what is known as a “golden cross” formation. For the uninitiated, a golden cross is historically one of the most reliably bullish signals in technical analysis. This setup typically indicates that short-term momentum is stronger than long-term trends, suggesting buyers are in control across multiple timeframes.
The Squeeze Momentum Indicator showing “off” status might seem counterintuitive during a rally, but it actually suggests the recent volatility expansion has already played out. This indicator identifies when markets compress before explosive moves—with it off, we’re likely in the expansion phase already.
The price resistance Cardano has faced for much of the year is still in play. Weak, but in play. How the next few trading days play out will help determine if ADA is now out of its multi-month bearish trend.
Key Levels:
- Immediate support: $0.86 (previous resistance turned support)
- Strong support: $0.75 (50-day EMA zone)
- Immediate resistance: $1.00 (psychological barrier)
- Strong resistance: $1.20 (Fibonacci extension target)
XRP price: Inflation shock triggers selloff
XRP’s brutal 6% plunge to $3.07 is a great example of the broader market’s inflation panic. The Ripple-linked token dipped hard and cancelled out this week’s gains, unable to break past the $3.40 price resistance.
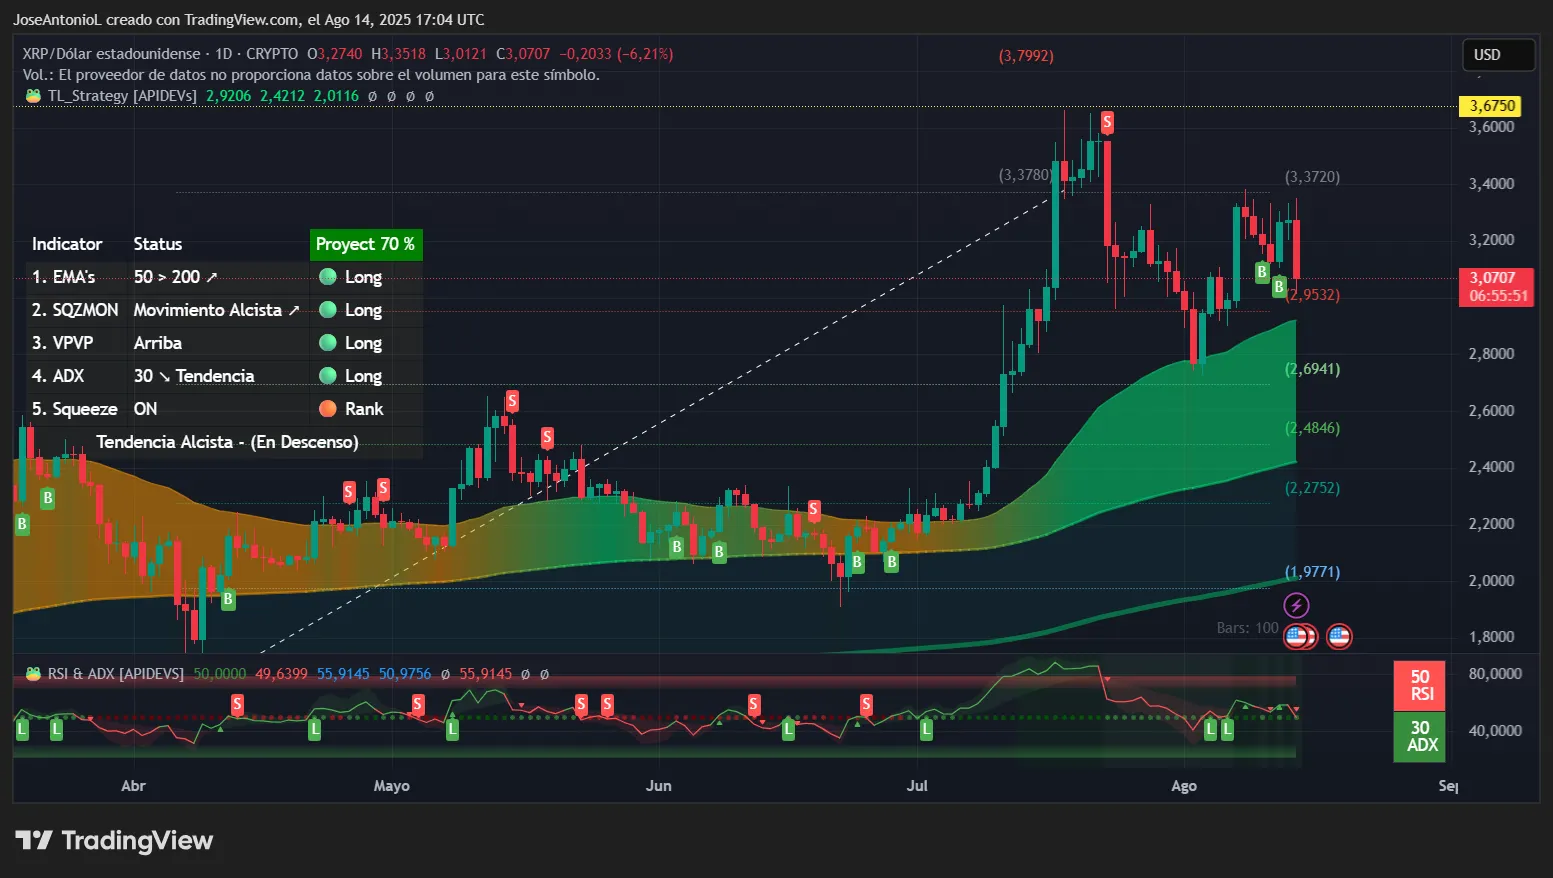
The RSI at 50 sits right at the perfectly neutral line—neither overbought nor oversold. After XRP’s massive run from $2.00 to nearly $3.70, this middling RSI actually represents healthy consolidation rather than weakness. It’s like a marathon runner catching their breath at the halfway point—not exhausted, but regrouping for the next leg. Traders view this neutral RSI as a “reload zone” where accumulation often occurs before the next directional move.
The ADX at 30 confirms we’re still in a trending environment despite today’s selloff. Readings above 25 indicate established trends, and at 30, the trend strength remains intact even amid the volatility. This suggests today’s drop might be a correction within a larger uptrend rather than a full reversal. Think of it as the market taking two steps back after taking five steps forward.
Day and swing traders might do well watching out for a possible double top formation that takes prices down near the EMAs once again. (That’s when prices create an “M” shaped movement, failing to break a resistance on two different occasions before switching to a bearish move.)
The 50-200 EMA spread remains bullish with the faster average above the slower one, maintaining the bullish formation. Each moving average acts as a potential support level during pullbacks, giving buyers multiple opportunities to step in. This configuration typically holds during healthy corrections and only breaks down during genuine bear markets.
In other words, traders would generally interpret this all to mean up is still more likely than down. And that sentiment is reflected on Myriad as well, where predictors still think it’s far more likely—placing odds at 67%—that XRP hits $4.00 before dropping back down to $2.00.
Key Levels:
- Immediate support: $2.95 (61.8% Fibonacci retracement)
- Strong support: $2.69 (Fibonacci retracement after breaking the weaker 50 day EMA price zone)
- Immediate resistance: $3.24 (broken support becomes resistance)
- Strong resistance: $3.39 (recent rejection level)
Disclaimer
The views and opinions expressed by the author are for informational purposes only and do not constitute financial, investment, or other advice.
Daily Debrief Newsletter
Start every day with the top news stories right now, plus original features, a podcast, videos and more.