In brief
- Crypto is in the red, with total market cap falling below $3.9 trillion.
- While all coins are feeling it, Dogecoin and XRP are getting it worse.
- The charts suggest there could be more downside to come.
Crypto markets continue their slide, cooling off from a red hot July. Bitcoin, of course, sets the tone, and it’s down again today to mark a nearly three-week low. But two of the crypto majors today are suffering worse than most: Dogecoin and XRP.
Total market capitalization has plunged 3.4% today to below $3.9 trillion just weeks after setting a new all-time high above $4.2 trillion. As you might expect from such a drop, trading volume has dried up, falling nearly 7% today to $180 billion. The selloff comes as markets position themselves ahead of Federal Reserve Chair Jerome Powell’s crucial Jackson Hole speech on Friday, where any hawkish surprise could trigger further downside.
Traditional markets reflect the same shift in sentiment, but the riskiest of risk assets are faring worse. The Crypto Fear & Greed Index has nosedived to neutral territory at 53 points, down from last week’s greed reading of 60. This signals that bullish momentum is quickly evaporating and market participants are becoming increasingly risk-averse.
Now, two of the most bullish coins in the past few weeks are suffering the consequences of the sudden slamming of the brakes: Elon Musk’s favorite meme coin Dogecoin, which is often highly volatile, and XRP, the Ripple-linked token that exploded in value after favorable regulatory conditions swung its way earlier this year.
Could the bottom be in? Sorry, traders, but the charts suggest there’s more pain ahead. Here’s why:
Dogecoin: Death by a thousand cuts
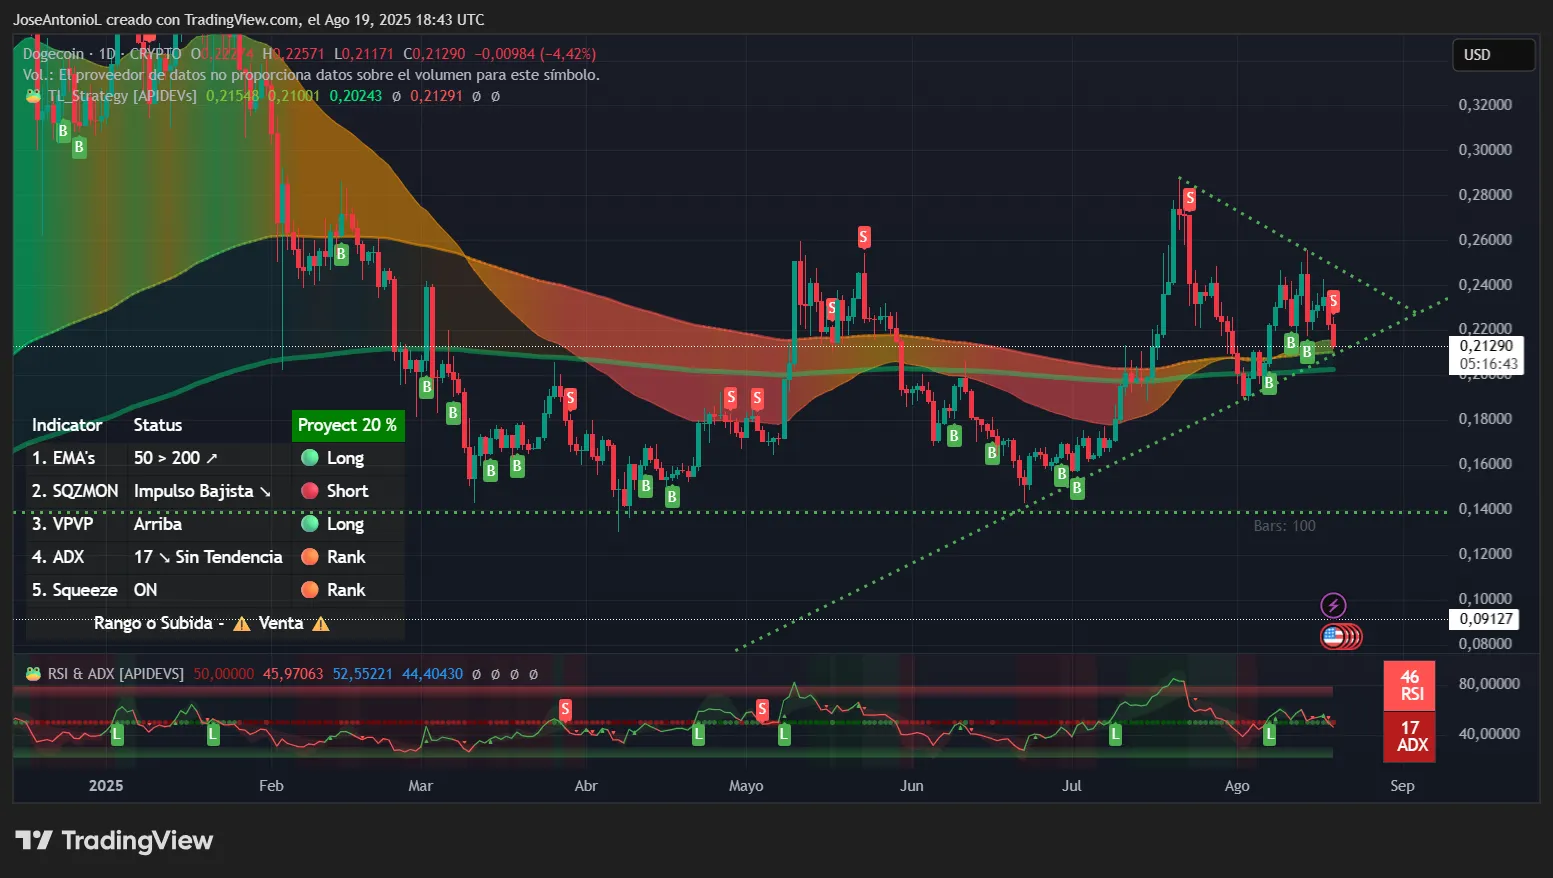
Dogecoin’s price action today tells a brutal story of failed breakouts and cascading liquidations. The meme coin opened at $0.225 (marked as “O” on the chart below) and has collapsed to close at $0.212 (that’s “C” on the chart), marking a 4.42% daily decline.
The intraday low at $0.211 (the “L” mark in the chart) briefly tested critical support before a weak bounce, but the damage was already done. The technical indicators paint an increasingly bearish picture in the short term.

Dogecoin’s Relative Strength Index, or RSI, is now at 41, which demonstrates how momentum has turned decidedly negative. RSI measures the balance between buyers and sellers on a scale from 0 to 100. When RSI drops below 50, it indicates sellers are dominating buyers. At 46 for DOGE, we’re seeing accelerated sell pressure without yet reaching oversold conditions below 30. Yes, that’s as bad as it sounds.
The bottom line is this chart screams more downside is likely, since sell-happy traders aren’t even close to reaching levels where buyers would then step in and bounces typically occur.
The Average Direction Index, or ADX, for DOGE is particularly concerning. ADX measures trend strength, regardless of direction, but likewise on a scale from 0 to 100. Readings above 25 typically confirm a trend is in place while below 20 suggests no clear trend, and therefore choppy, directionless trading to come. DOGE is at 17.
That means Dogecoin is stuck in another no-man’s land, indicating that momentum after the initial price spike weeks ago is now dying. This typically results in continued sideways-to-down grinding that slowly bleeds investor confidence.
What’s more, the exponential moving average configuration is also flashing “danger” signals. Traders use EMA to gauge price supports and resistances by taking the average price of the asset for a given period of time.
For DOGE, the 50-day EMA is sitting above the the 200-day EMA (as shown by the green and orange bands on the chart). That’s typically bullish (the shorter term average price is higher than the longer term one). But here’s the rub: the prices are very close, suggesting DOGE is in a compression zone. The current price of Dogecoin has fallen below the 50-day EMA and can easily break below the 200-day EMA.
That’s not what traders like to see. If this pattern continues, it may be a confirmation that the golden cross from the previous days was a false start, and the spike was just momentum driven instead of a real shift in the trend.
The coin is currently inside a symmetrical triangle that could easily last throughout all of September. And as seasoned crypto traders know, September is typically not a great month for markets, so that might spell trouble for DOGE.
Key Levels:
- Immediate support: $0.20 (psychological level from previous consolidation)
- Strong support: $0.140 (major Fibonacci retracement)
- Immediate resistance: $0.23 (weak resistance zone)
- Strong resistance: $0.25 (top of the triangle pattern)
XRP price: Breaking bad
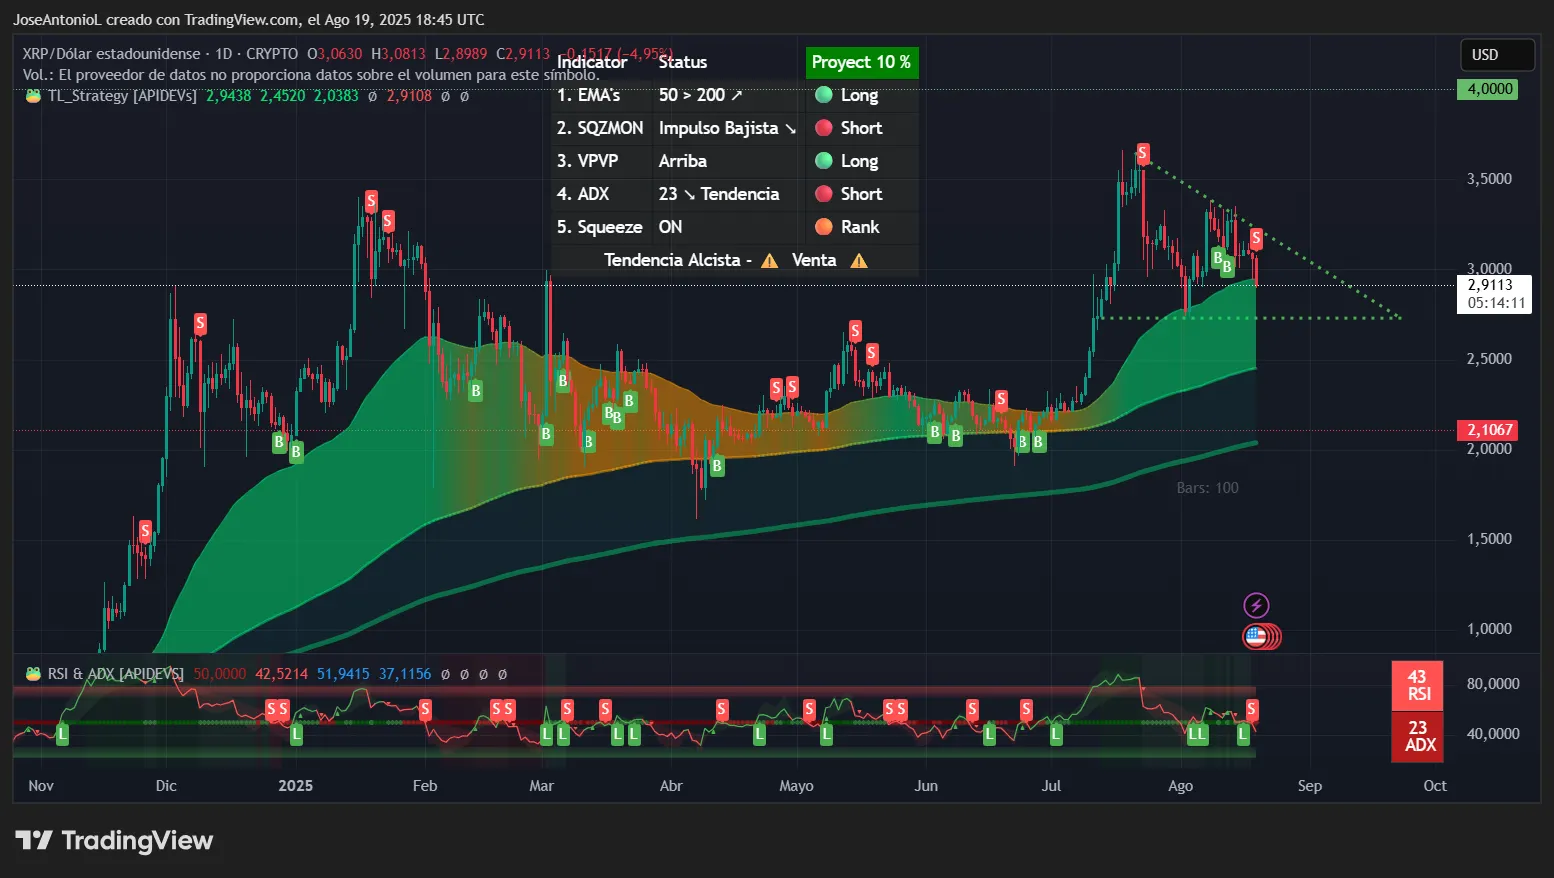
XRP’s chart reveals a similar collapse, with the token opening at $3.063 before crashing to close at $2.911 for a 4.95% daily decline. The significance of XRP losing the $3.00 support level cannot be overstated: It might sound overly simplistic, but round numbers often act as magnets for stop-losses and margin calls for traders.

Over on Myriad, a prediction market developed by Decrypt‘s parent company Dastan, traders have been keeping a close eye on this precise price point for XRP. Traders have been divided on where they think XRP goes next: up to $4 per coin, or back down to $2. Just days ago, Myriad users placed the odds at 75% that XRP heads to the moon. But now? Those odds have sunk to just 54%.
The charts suggest the flip in bearish sentiment is warranted.
XRP’s RSI is at 43, which puts it in distinctly bearish territory. When RSI falls below 45, it typically signals a shift in market structure from bullish to bearish. At 43, we’re seeing confirmation that buyers have lost control, but we’re not yet at the level where contrarian traders start looking for oversold bounces. This “dead zone” between 30-45 often sees the most painful grinding lower as neither momentum traders nor value hunters are interested.
If the pattern holds, the support should be the area in which the RSI is at its lowest. And it could be at around $2.50 to $2.70 when we see some real clash between bulls and bears.
The ADX at 23 tells us something important. The overly bullish trending of weeks past is struggling to keep momentum. Given the bearish price action, if prices keep going down and the ADX pushes above 25 in coming sessions, it would confirm a bearish trend is taking hold, likely triggering systematic selling from trend-following algorithms.
But if the XRM Army is looking for copium, here it is: XRP’s EMA setup is forming a golden cross.
The 50-day EMA crossing above the 200-day is what traders call a golden cross, and it’s normally a classic bullish signal. But with the current price now trading below the 50-day EMA, XRP’s closing weekly cable will play a key role in how traders read the charts. There is a chance traders attempting to buy the dip at these moving-average levels will have to wait for longer times than expected in order to match either their stop-loss or take-profit triggers, adding to sell pressure in the short term as other volatile assets become more appealing.
Key Levels:
- Immediate support: $2.75 (200-day EMA and previous resistance from May)
- Strong support: $2.34 (major horizontal support from Q2 accumulation zone)
- Immediate resistance: $3.2 (triangle resistance)
- Strong resistance: $3.39 (broken triangle pattern)
Disclaimer
The views and opinions expressed by the author are for informational purposes only and do not constitute financial, investment, or other advice.
Daily Debrief Newsletter
Start every day with the top news stories right now, plus original features, a podcast, videos and more.


