
In brief
- September got off to a hot start, but the seasonal “Red September” curse might now be kicking in.
- Bitcoin is now just 4% away from marking another down month in September, historically the worst month of the year for markets.
- Myriad prediction market users remain somewhat bullish, but the charts paint a less rosy picture.
Just when it looked like Bitcoin and the rest of the crypto market might escape the seasonal curse, Red September has once again reared its ugly head.
With Bitcoin falling below $113,000, and the overall crypto market sliding 3.8% to under $4 trillion, BTC is now just 4% away from painting another red monthly candle during what is historically its worst month of the year.
Notably, tradfi markets aren’t suffering the same fate at the moment and are instead hovering near all-time highs, with the S&P 500 up half a percentage point, sitting above 6,690 points. And yet, digital assets are getting absolutely hammered, with only five coins in the top 100 by market cap managing to stay in the green.
The Crypto Fear and Greed index is still in neutral territory, but below the perfect balance at 45 points—the lowest reading since the beginning of September.
Where to from here? Here’s what the charts have to say:
Bitcoin (BTC) price: Support levels under siege
Bitcoin opened the day at $115,275 before sliding 2.19% to close at $112,769, briefly touching an intraday low of $111,986 that had traders sweating bullets as it threatened to break below its multi-month support level.
At the moment, Bitcoin is holding near the psychologically critical $112K level, but sellers continue to dominate.
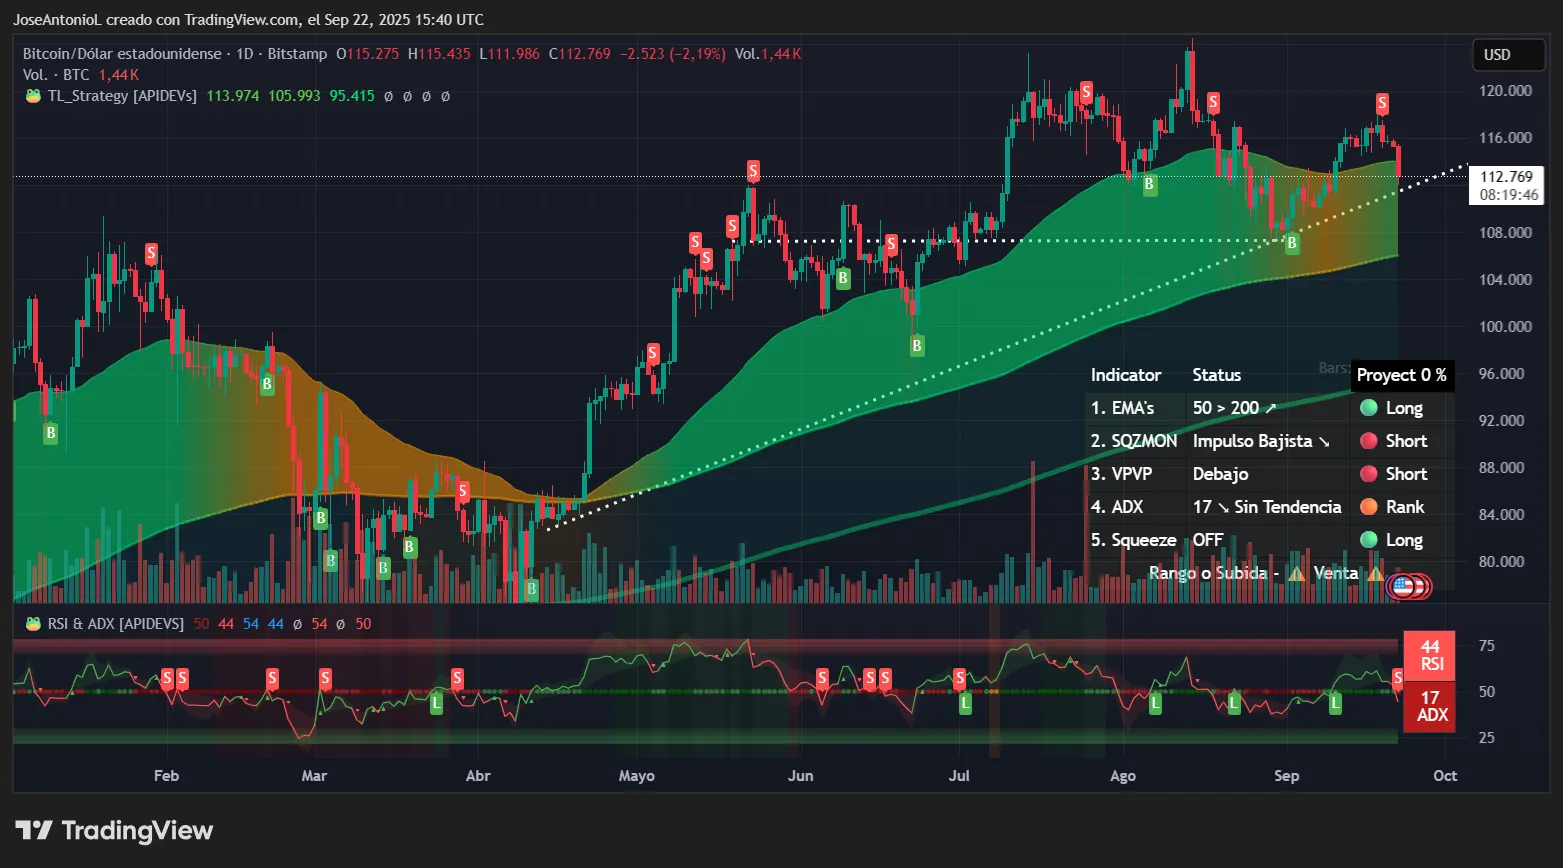
What’s more, the technical picture for Bitcoin looks increasingly bearish. Bitcoin’s Relative Strength Index, or RSI, is at 44, signalling weakening momentum. RSI measures price momentum on a 0-100 scale, where readings below 50 indicate sellers are in control. This reading suggests Bitcoin has room to fall further before hitting oversold territory below 30. Traders would interpret this as bearish since they typically wait for RSI to drop below 30 before considering bounce plays.
The Average Directional Index, or ADX, for Bitcoin at 17 tells an even more concerning story. ADX measures trend strength, regardless of direction, with readings above 25 indicating a trend is in place. Anything below 20 suggests no clear trend and choppy, directionless trading. In this case, though, what it really shows is that the upward momentum that carried Bitcoin to new all-time highs has lost steam on the daily chart. Traders might then expect to see violent whipsaws in either direction.
For technically minded Bitcoin bulls, the one silver lining comes in the form of the exponential moving averages and their current configuration. These moving averages, or EMAs, give traders a sense of current levels of price support and resistance over the short, medium, and long term.
With the short-term average, the 50-day EMA, still above the 200-day average, Bitcoin’s price is maintaining what is broadly interpreted as a technically bullish structure. But this is cold comfort when BTC’s current price is trading well below the EMA50 average.
The Squeeze Momentum Indicator showing “off” status confirms what the low ADX suggests—we’re in a consolidation phase with no clear directional bias. It’s the sort of setup that makes some holders nervous, because it means the next big move could be explosive in either direction.
In short, trading below the 50-day EMA is not good for bulls. If this trend continues, Bitcoin would settle into decisively bearish territory.
Even still, there remains some bullish sentiment in the air.
On Myriad, a prediction market built by Decrypt’s parent company Dastan, users do not currently believe Bitcoin falls as low as $105,000 this month, placing odds at 85% that BTC manages to say above that mark.
In a separate market, though, Myriad users say there’s a 56% chance Bitcoin hits $105K before touching a new all-time high of $125K. And those odds are up from 28% just four days ago.
Key Levels:
- Immediate support: $111,000 (today’s low)
- Strong support: $108,500 (psychological level)
- Immediate resistance: $115,000 (opening price)
- Strong resistance: $118,000 (recent highs)
Ethereum (ETH) price: October rally dreams crushed
Meanwhile, Ethereum, falling 7% today to a low of $4,082.96, is faring even worse than Bitcoin, reflecting its higher beta nature during market stress.
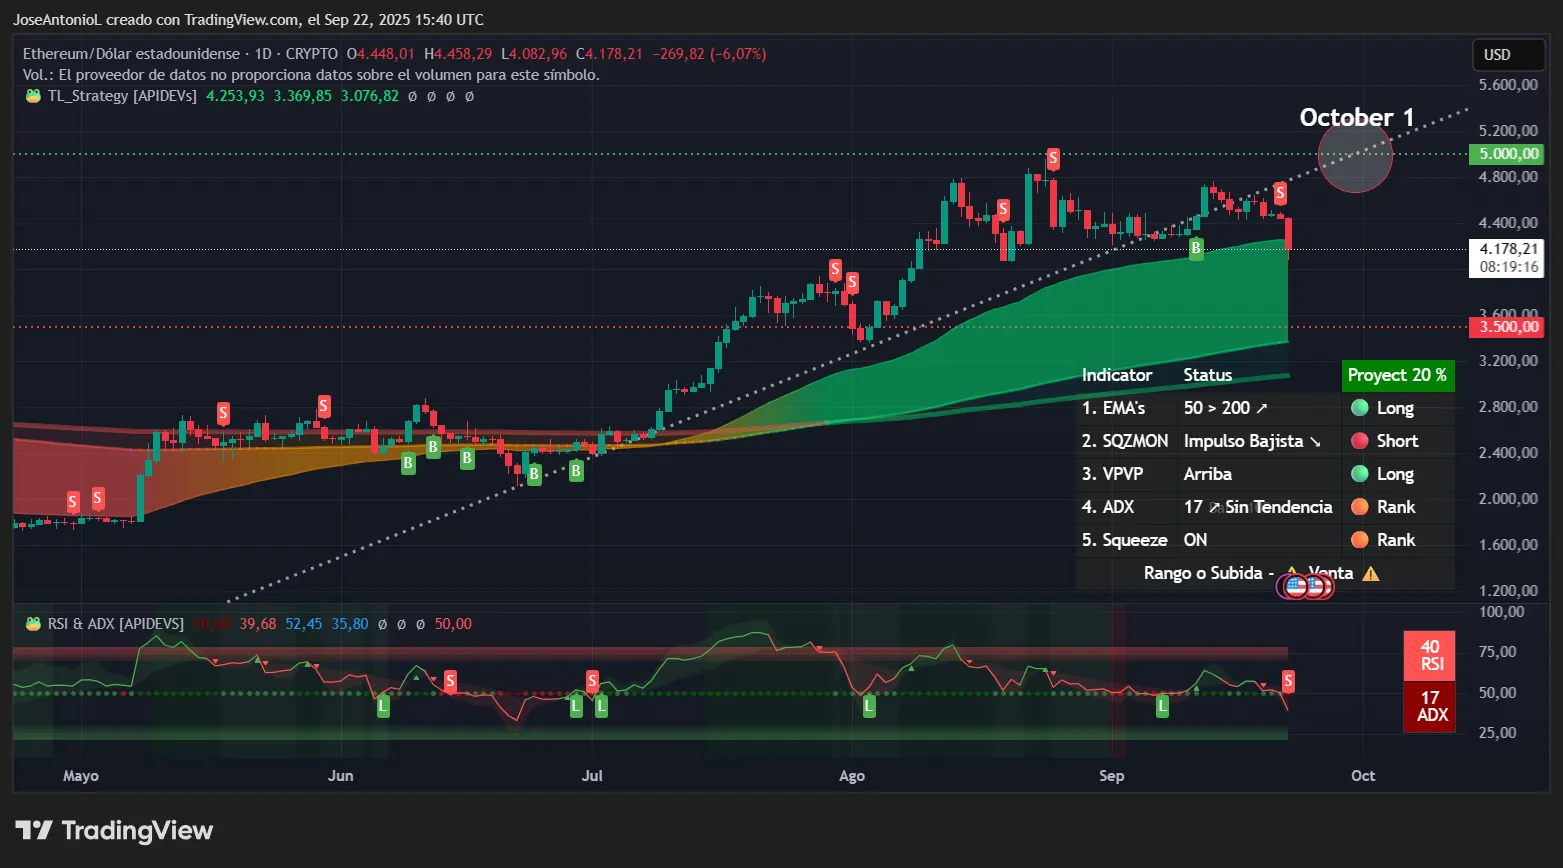
Ethereum’s RSI plunging to 40 represents a sharp momentum shift. This level sits in no-man’s land—not oversold enough to attract dip buyers, but weak enough to discourage new longs after a very strong year. Judging this indicator alone, more traders than not would conclude further downside is likely before we hit the oversold bounce zone below 30, where algorithmic buying typically kicks in.
The ADX reading of 17 mirrors Bitcoin’s weakness, confirming the lack of trend strength after a pretty solid trend. For traders, this means avoiding leverage at all costs. When ADX sits below 20, markets tend to chop sideways violently, liquidating both longs and shorts. The low ADX combined with the sharp price drop suggests we’re in distribution mode, where smart money is quietly exiting positions.
In this kind of environment, day traders may opt to open and close quick positions near the support and resistance zones set by the horizontal channel in formation.
Here’s where it gets interesting: the Squeeze Momentum Indicator shows ”on” status, unlike Bitcoin’s “off” reading. This indicator identifies when volatility compresses before explosive moves, and an “on” signal during a selloff usually suggests the consolidation phase may be ending and a larger move down could be imminent. Of course, the indicator alone could also point to a bullish move, but in conjunction with the other signals it suggests a bearish move is more likely.
Despite the carnage, optimism persists elsewhere: On Myriad, predictors still believe ETH will hit $5,000 this year, placing odds at 64%. But it’s all in how you look at this too: These odds are down sharply from a high of 92% in August and even 85% just days ago, signaling a clear erosion of confidence even among bulls.
Key Levels:
- Immediate support: $4,080 (today’s low)
- Strong support: $3,500 (psychological level)
- Immediate resistance: $4,450 (opening price)
- Strong resistance: $5,000 (October 1st target marked on chart)
Dogecoin (DOGE) price: Meme coin massacre
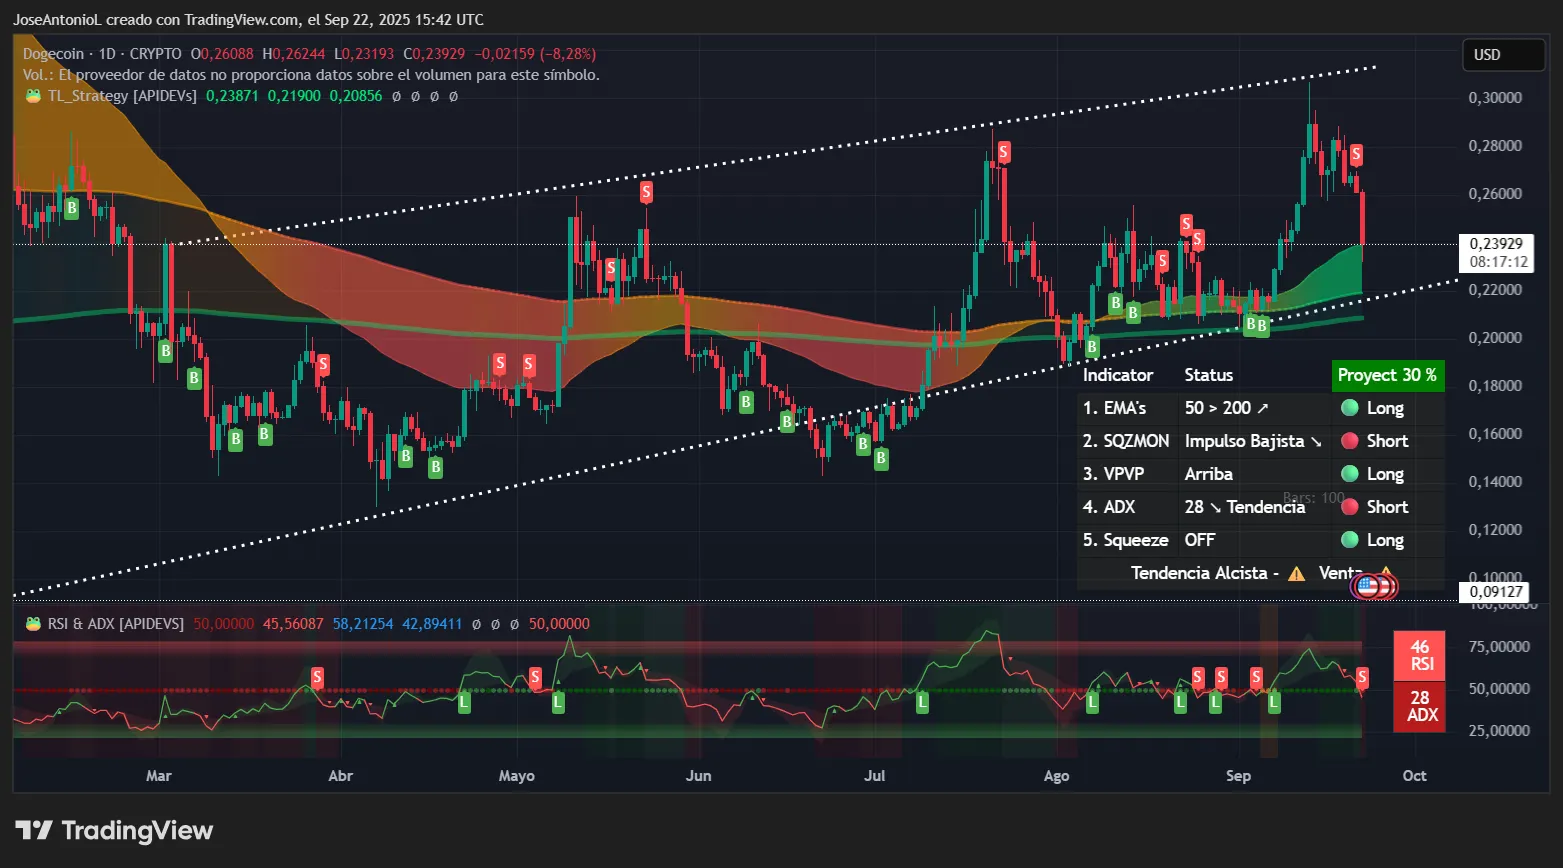
And what of Elon Musk’s favorite meme coin, Dogecoin? It’s getting absolutely destroyed today, down a whopping 10% and earning the title of the worst-performing coin in the top 10 by market cap.
Trading at just over $0.23, Dogecoin’s RSI is at 46, which might seem neutral. But context is everything. After such a violent drop, traders are more likely to interpret this middling reading as bearish. It shows sellers aren’t exhausted yet.
Typically after a 10% daily drop, you’d expect RSI to be oversold below 30. But at 46, it suggests there’s more pain ahead before bargain hunters step in.
The ADX at 28 is the one technical bright spot, relatively speaking. Unlike Bitcoin and Ethereum’s anemic sub-20 readings, Dogecoin’s ADX above 25 confirms we have an actual trend in play.
The 50-day EMA maintaining its position above the 200-day EMA provides minimal comfort. The price broke below that line, but after a brief period of time it managed its way back up and is currently trading almost exactly at EMA50 levels. That’s not much to get excited about if you’re a DOGE bull, since even a slight move below current levels could point to a very ugly trend in the near future.
Key Levels:
- Immediate support: $0.22 (EMA200)
- Strong support: $0.20 (psychological level)
- Immediate resistance: $0.24 (current price area)
- Strong resistance: $0.20 (psychological level)
Disclaimer
The views and opinions expressed by the author are for informational purposes only and do not constitute financial, investment, or other advice.
Daily Debrief Newsletter
Start every day with the top news stories right now, plus original features, a podcast, videos and more.