Key Takeaways
How did Bitcoin make a new all-time high?
Steady BTC demand and a wave of short liquidations spurred the leading crypto beyond $125k.
What is the next bullish target?
The immediate resistance level to keep an eye on is the $133.5k level, which could be a potential resistance zone.
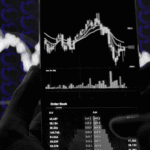
On the 5th of October, Bitcoin [BTC] set a new all-time high at $125,599, per data from CoinMarketCap. At the time of writing, BTC was trading at $125k and appeared likely to jump higher quickly.

Source: BTC/USDT on TradingView
The price chart showed that two key supply zones (red) at $117k and $124k have been overcome. Liquidations also showed room for bullishness.
Over the past 24 hours, CoinGlass data showed Bitcoin saw $148.47 million in liquidations, with $131.96 million being short liquidations.
The crypto market as a whole experienced $345.5 million in liquidations, with $220.6 million being short positions.
The U.S. government shutdown meant the short-term outlook had been uncertain, though Q4 expectations were still bullish.
Traditionally a positive month for crypto, October might indeed become Uptober with the new all-time high.
The government shutdown has sparked a rally despite the political uncertainties- the question is, how much higher can this impulse go?
Short-term Bitcoin price targets
Demand for Bitcoin has been steady recently. Spot exchange-traded funds (ETFs) saw strong inflows last week, a trend that should continue if the prices continue to climb past $125k.
AMBCrypto reported that extremely low BTC inflows to Binance, combined with buyer dominance, fueled the gains over the past week.

Using the Bitcoin pricing model from the checkonchain suite of metrics gave clues on where the prices could go next.
The short-term holder price model used the STH realized price and its standard deviations to generate statistically significant price bands.
At the time of writing, the STH realized price was at $112.8k, marking a vital short-term support. The immediate resistance level at $124.8k has been overcome, though the chart above has not updated to reflect this.
This meant that the STH +1σ (standard deviation) level at $133.5k is the next bullish price target.
Back in May and July, the STH +1σ realized price level has served as resistance, and could do so once again. In a post on X, crypto analyst Axel Adler Jr pointed out the same possibility.