- ONDO’s price analysis revealed a descending triangle, indicating a consolidation phase with lower highs and a flat support level
- Liquidation heatmap indicated that liquidations were clustered around $1.10 to $1.20
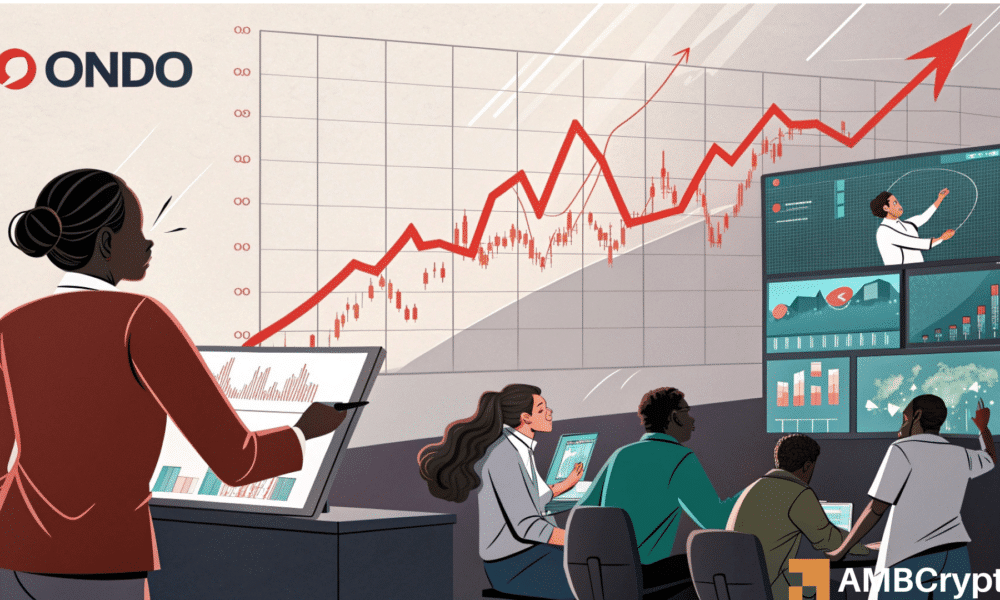
ONDO gained significant traders’ interest over the last few weeks. In fact, market analysis revealed a potential 47% price hike, with the altcoin nearing a breakout from a descending triangle pattern on the price charts.
Chart patterns hint at major breakout ahead
That’s not all though as ONDO’s price analysis highlighted the formation of a descending triangle, indicating a consolidation phase with lower highs and a flat support level near $1.0837. The tightening price range can be interpreted to imply that a breakout may be imminent.

Source: CoinGlass
However, the Relative Strength Index (RSI) stood at 34.78, nearing oversold territory. This has historically preceded strong reversals for ONDO – A sign that there may be potential recovery from its prevailing downtrend.
Meanwhile, the Aggregated Spot CVD surged, reflecting strong buying volume despite the price decline. This divergence between the CVD and the price alluded to accumulation, reinforcing the breakout potential on the charts.
Together, these signals placed ONDO at a critical juncture – With the RSI suggesting a rebound, CVD indicating accumulation, and the descending triangle formation aligning with historical bullish breakouts.
Is ONDO ready for a rebound?
ONDO’s liquidation heatmap revealed insights into leveraged positions. Over the last 24 hours, heavy liquidations seemed to be clustered around $1.10 to $1.20 – Hinting at the removal of most leveraged long positions.

Source: Coinglass
This fall in open leverage has reduced the risk of forced sell-offs, creating a more stable price environment. Additionally, the absence of dense liquidity pockets meant that fewer traders held high-risk leveraged positions, allowing ONDO’s price to move more freely.
Hence, this pattern supported the hypothesis of a breakout. Especially as reduced downside risk left room for upward movement on the charts, with limited sell pressure from liquidations.
Institutional confidence grows as capital flows surge
ONDO’s spot inflow/outflow data revealed a notable surge in netflows, particularly on 24 February 2025 – A day $40 million in inflows coincided with ONDO’s price hitting $2.33. This pattern mirrored past accumulation phases, where large inflows have preceded price recoveries.

Source: Coinglass
A key factor behind ONDO’s traction has been Pantera Capital’s investment. As a leading crypto investment firm with a $4 billion portfolio, Pantera’s backing of Ondo Finance added legitimacy and institutional confidence. Their involvement is a sign of long-term bullish sentiment, reinforcing ONDO’s real-world asset tokenization model as a growth driver.
This combination of strong netflow activity and institutional backing has strengthened the case for a 47% price hike, aligning with bullish technical signals.
Strong market positioning reduces selling pressure
ONDO’s break-even price analysis revealed a current price of $1.07, with 80.04% of traders in profit and 10.74% in loss. The distribution of break-even levels showed profit zones below $0.50 and loss zones above $1.19 – A sign of limited sell pressure from unrealized losses.

Source: IntoTheBlock
Also, a crucial takeaway was the low-risk exposure of 9.21% of positions, indicating that ONDO’s market structure favored an upward breakout over a collapse. This trend echoed the liquidation heatmap, reinforcing the idea that ONDO’s price had room for growth.
With historical break-even trends supporting bullish reversals, traders can see this as another confirmation of ONDO’s 47% upside potential.
In conclusion, institutional backing, particularly from Pantera Capital, has further bolstered confidence in ONDO’s long-term market trajectory. With key indicators aligning for a bullish move, traders should anticipate a significant upward shift.
However, market sentiment and broader macroeconomic conditions would ultimately determine whether ONDO can achieve its projected 47% surge or face another consolidation phase.