
- After multiple CHoCH and BOS, Chainlink sat at a key $12 support zone as of press time.
- Strong reaction here could trigger a move back toward $16-$18, while a break could see LINK retest $10 or lower.
The price of Chainlink [LINK] was trading around $12, which was about 11% drop in 24 hours.
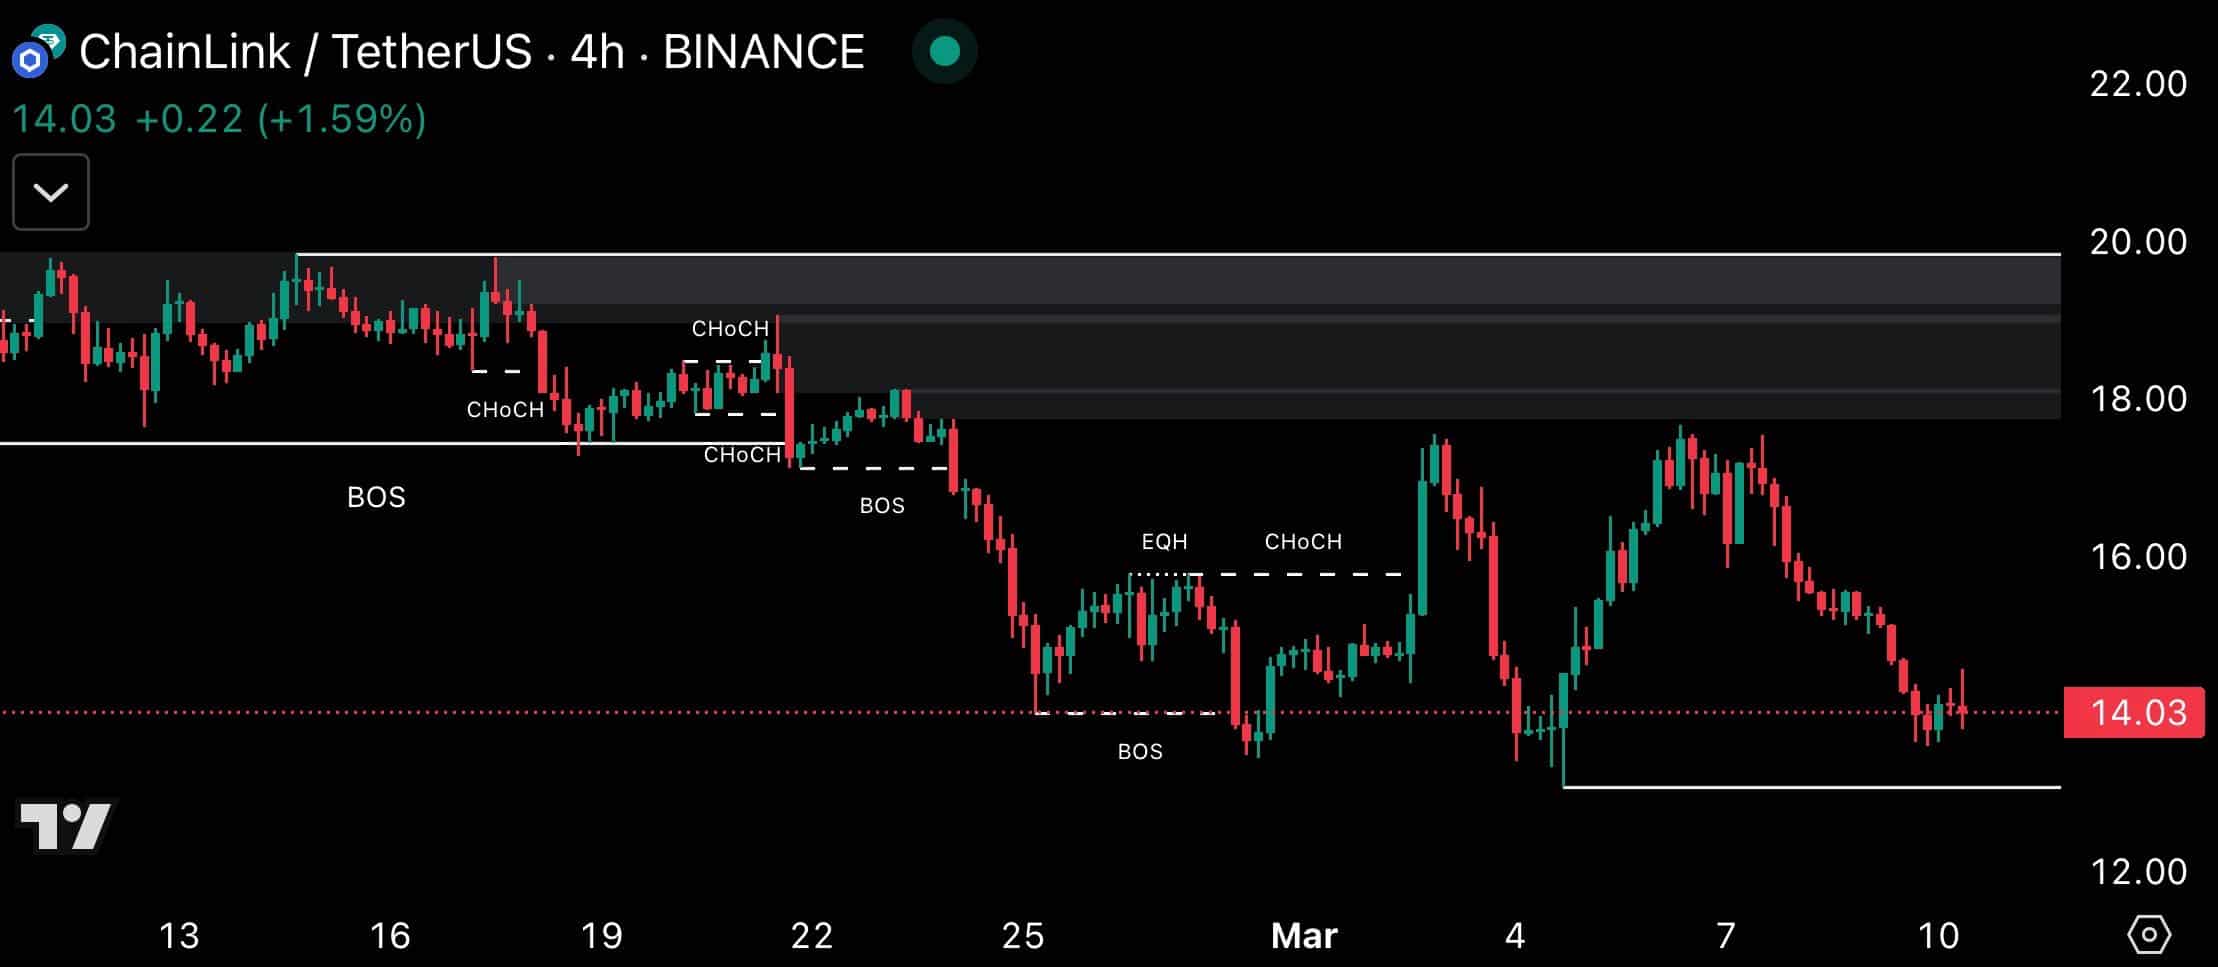
The 4-hour price action highlighted multiple Change of Character (CHoCH) and Break of Structure (BOS) points, indicating market structure and momentum changes.
Chainlink, trading in a downtrend from a high around $20.00, with CHoCH and BOS around $18.00, $16.00, and $14.00, confirmed the weakening bullish strength.
A sweep of Equal Highs (EQH) around $16, which was followed by the BOS below $14.03, cemented the bearish outlook.
Source: Trading View
If the $12.00 support holds, a strong bullish response can take LINK back towards $16.00-$18.00, which is consistent with the resistance zone.
A breakdown below $12.00, however, can see a retest of $10.00 or lower, possibly $8.00-$9.00, if bearish momentum continues.
The $14 level is pivotal; a close above $15 would invalidate the bearish scenario but a drop below $12.00 would confirm further downside. Volume and candle patterns near the area of $12.00 will be important for confirmation.
Determining LINK’s key levels from profitability charts…
More analysis of LINK’s “In/Out of the Money Around Price” showed that $12.00 was currently the most important support level.
The “In the Money” addresses which was 43.78%, about 674.2M LINK volume, showed strong support at this level.
The “Out of the Money” accounted for 55.19%, about 605.8M LINK, which showed potential resistance above levels higher than the current price, where 1.13M LINK were at the money.
The 43.78% below $12.00 buying zone supports a potential bottom if LINK is heading lower, as buying demand is certain to hold this level.
A hold at this level can push LINK to the $14.00 resistance area, where selling pressure high.

Source: IntoTheBlock
A break below $12.00, where only 0.98% are at break even, can register a fall to $10.00, where there is little support.
43.78% to 55.19% difference is a threshold point; prolonged buying over $12 can indicate a bull run, and a fall below can trigger further selling.
Furthermore, the “Active Addresses by Profitability” showed that most of these holders purchased LINK at around $4.00.
This makes it a key support level to keep a close eye on as it comprises early adopters. For these active addresses, 54.46% bought for less than $12.
Only 5.12%, about 51.14m LINK, were at the money. The range of $4-$9.99 indicated a probable support region if LINK falls, with the bulls set to defend it to prevent further losses.

Source: IntoTheBlock
A fall to $4 is only likely if bear pressure overpowers the bulls. However, the 54.46% in profit can cause buying to salvage gains, limiting losses around $10.
Breaking below $12 could mean testing $10 but staying above could see LINK reverse. The “at money” holders reflected little selling pressure, holding slight bullish sentiments unless volume blows down.