
- Bitcoin’s recent 22% decline is drawing comparisons to past bull cycle corrections.
- This analysis examines historical trends, market conditions, and BTC’s potential next move.
Less than three months into Trump’s second term, market volatility has surged to unprecedented levels. Bitcoin [BTC] has dropped 22% from its $109k all-time high, similar to corrections seen in the 2016-17 bull run.
During that cycle, BTC delivered a 122.8% full-year return, yet ended Q1 down 4% from its opening price of $434.46. However, this year’s deeper decline raises questions.
Is BTC mirroring the 2018 Q1 crash (- 48%) to $6,929, instead? AMBCrypto explored this possibility.
2018 macro parallels: Trade war and Bitcoin’s 72% crash
In 2018, Bitcoin closed the cycle with a 72% yearly decline, bottoming at $3,740.50.
Notably, macro conditions at the time closely resemble today’s landscape – Trump’s trade war with China and escalating tariffs. By mid-Q2 2018, inflation spiked to a two-year high of 2.9%.
In response, Bitcoin, which had surged to $9,826 in April, suffered a 40% quarterly decline.

Source: BitBo
Now, as Q2 unfolds, the crypto market faces renewed macro pressures.
With $7 trillion in debt refinancing ahead, investors are shifting capital into safe-haven assets like bonds – a trend confirmed by the 10-year treasury yield (interest on bonds), which has dropped to a two-month low.
Simply put, the bond market is absorbing liquidity, pulling capital away from risk assets as the U.S. government secures cheaper borrowing rates.
If this trend continues, Bitcoin and broader crypto markets could face heightened downside risk, increasing the probability of a 2018-style crash.
On-chain indicators signal BTC capitulation risk
According to Glassnode’s latest report, Bitcoin’s market structure has shifted from accumulation to distribution. Meanwhile, the Accumulation Trend Score remained close to 0.1, reflecting consistent sell pressure since January.
Additionally, the Cost Basis Distribution (CBD) heatmap shows a decline in “buy-the-dip” activity below $92K, indicating reduced demand for accumulation.
Short-Term Holders (STHs) are exhibiting signs of capitulation. The STH Spent Output Profit Ratio (STH-SOPR) has stayed below 1, suggesting that many investors are selling at a loss.
It reached 0.97 when Bitcoin fell to $78K, highlighting significant capitulation.
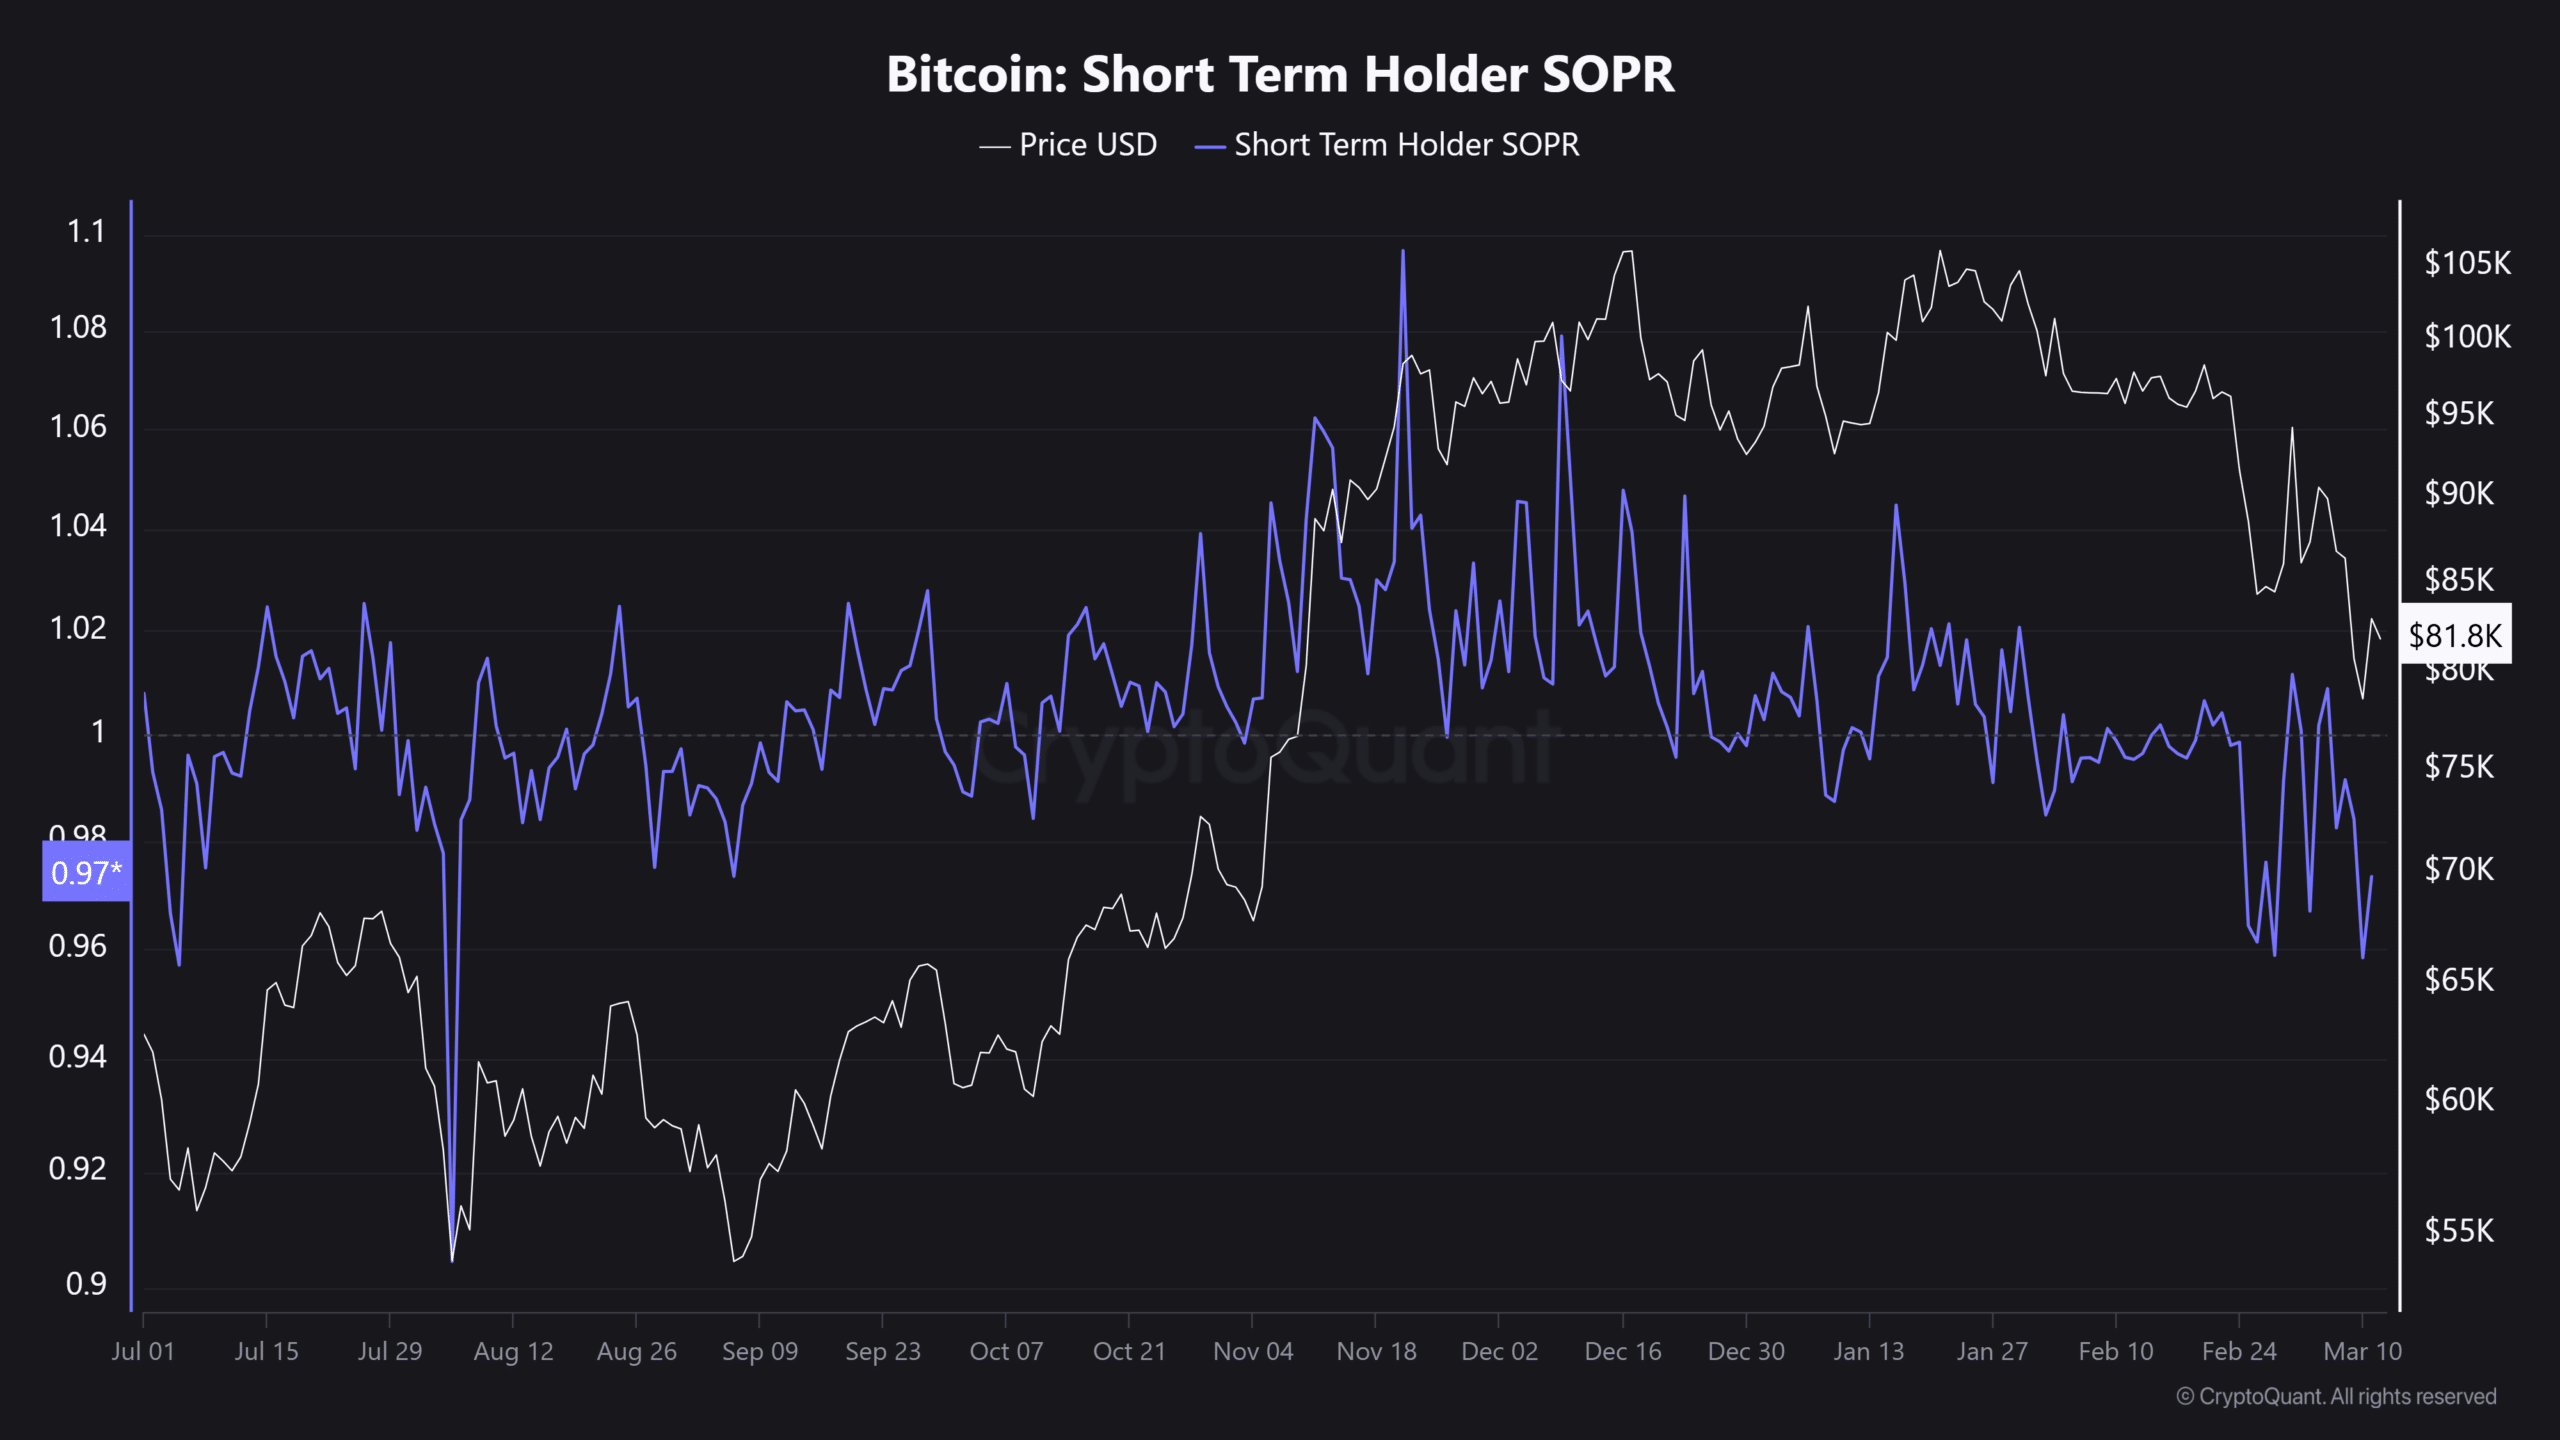
Source: CryptoQuant
This pattern closely resembles August 2024, when Bitcoin plummeted to $49K under intense selling pressure.
At present, accumulation remains weak at critical demand zones, despite Bitcoin trading 22% below its all-time high of $109K. This reflects a clear risk-off sentiment, with buyers showing reluctance to enter the market.
Coupled with prevailing macroeconomic challenges, the current scenario increasingly mirrors the 2018 crash, where extended distribution led to prolonged downward movements.
As a result, Bitcoin faces an elevated risk of further corrections before establishing a strong support level.