
- Despite sizeable gains since November, the daily chart revealed a bearish price structure
- Long-term holder unrealized profit/loss metric revealed similarities to the 2021 cycle top
The on-chain signals behind the strong XRP gains in the past six months have been mixed so far. The supply in profit was high, as expected, but the sentiment behind the token was negative.
In fact, the net unrealized profit/loss revealed similarities to April 2021 and this could be eerie for the bulls.
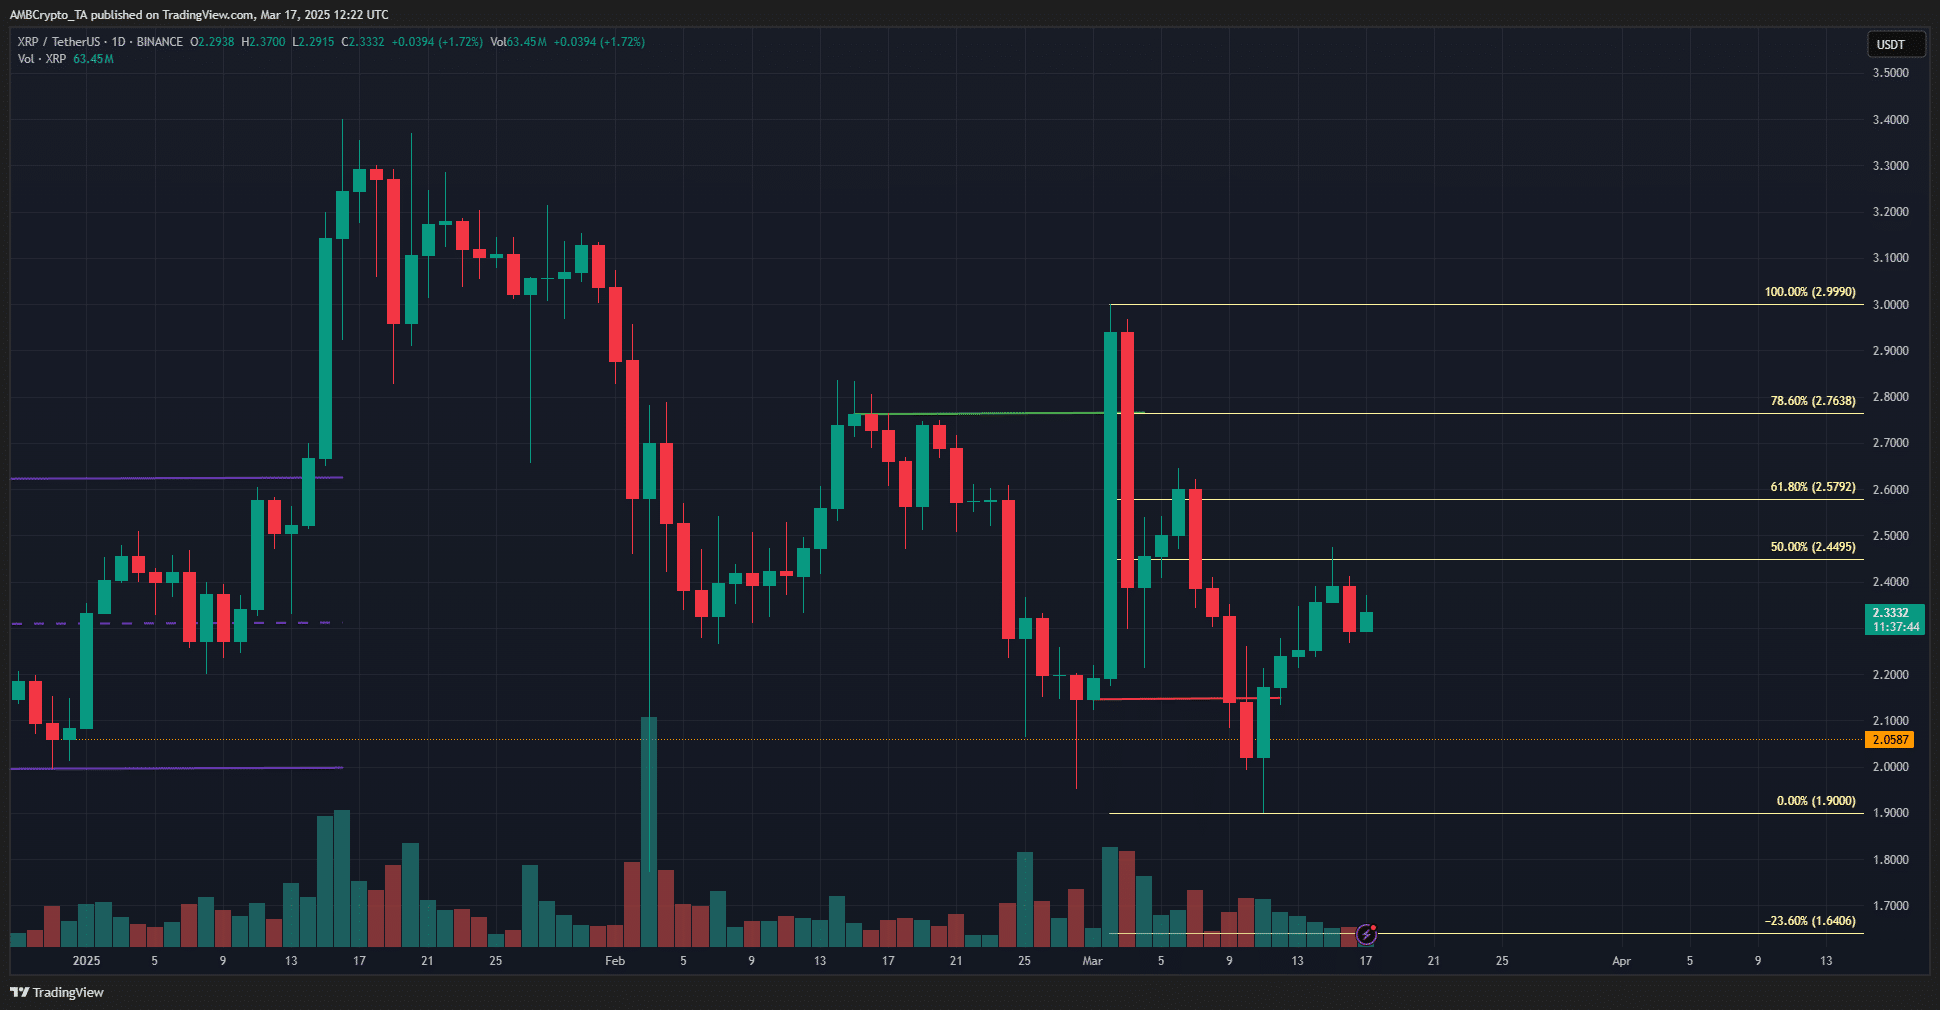
Source: XRP/USDT on TradingView
The altcoin’s 1-day price action showed a bearish structure on the daily chart. This shift, highlighted in red, occurred a week ago when XRP slipped below the $2.19-level. Since dropping to $1.9, the altcoin has rebounded to test the $2.45-level as resistance.
This level happened to be the 50% retracement level of the move from $2.99 to $1.9. The rejection at $2.45 over the weekend highlighted the bearish pressure on the coin. Therefore, even though XRP has been up 370% since the U.S. Presidential Elections, sellers have had the upper hand.
High network activity boosts XRP investor morale
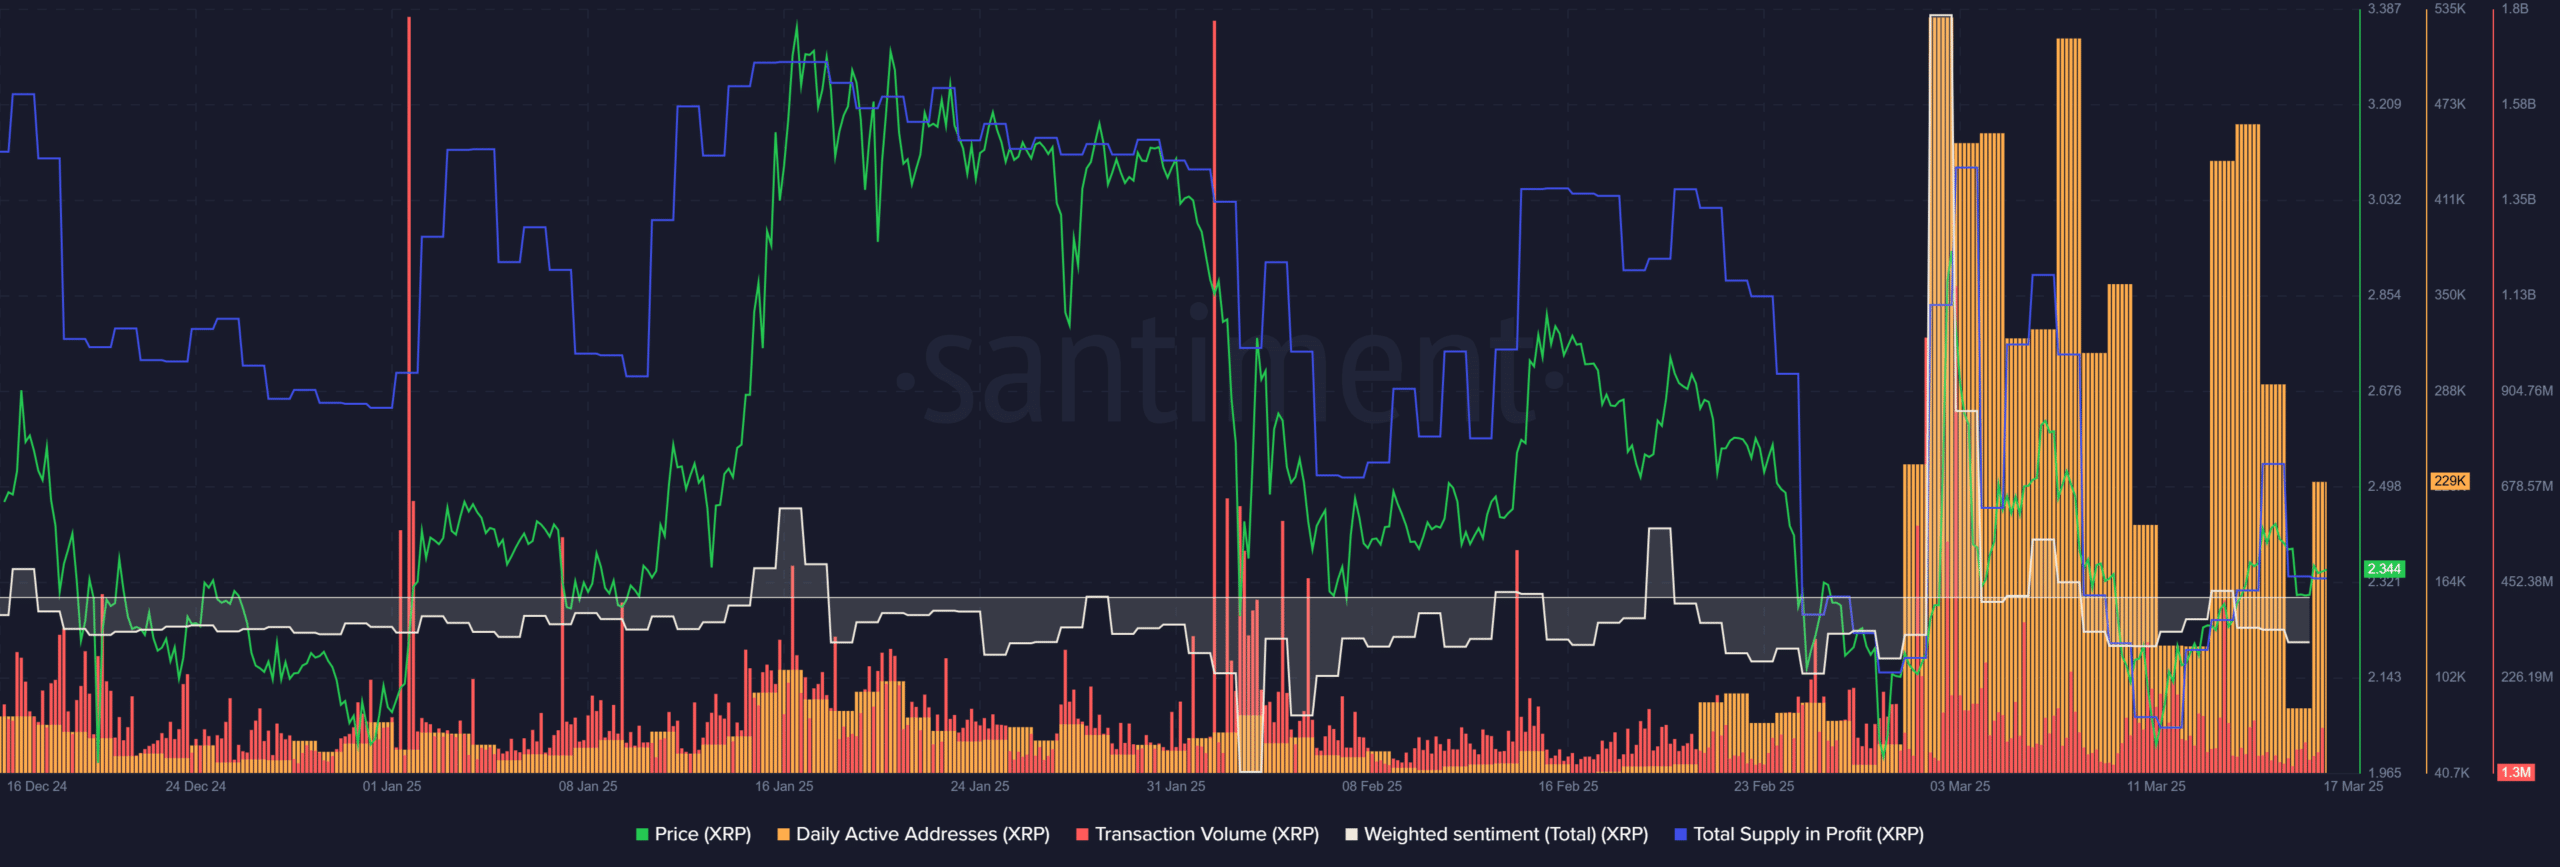
Data from Santiment underlined some positivity for investors. The total supply in profit has been falling alongside the price since January. However, it was still significantly higher than levels it had been at in October and November 2024.
The weighted sentiment, which tracks social media engagement related to XRP, was negative. It has been negative over the past three months, with only a few spikes of positive engagement.
The daily active addresses shot skywards in March. Although the numbers have receded somewhat, it was much higher than recent months. The transaction volume trends remained similar to the preceding three months.
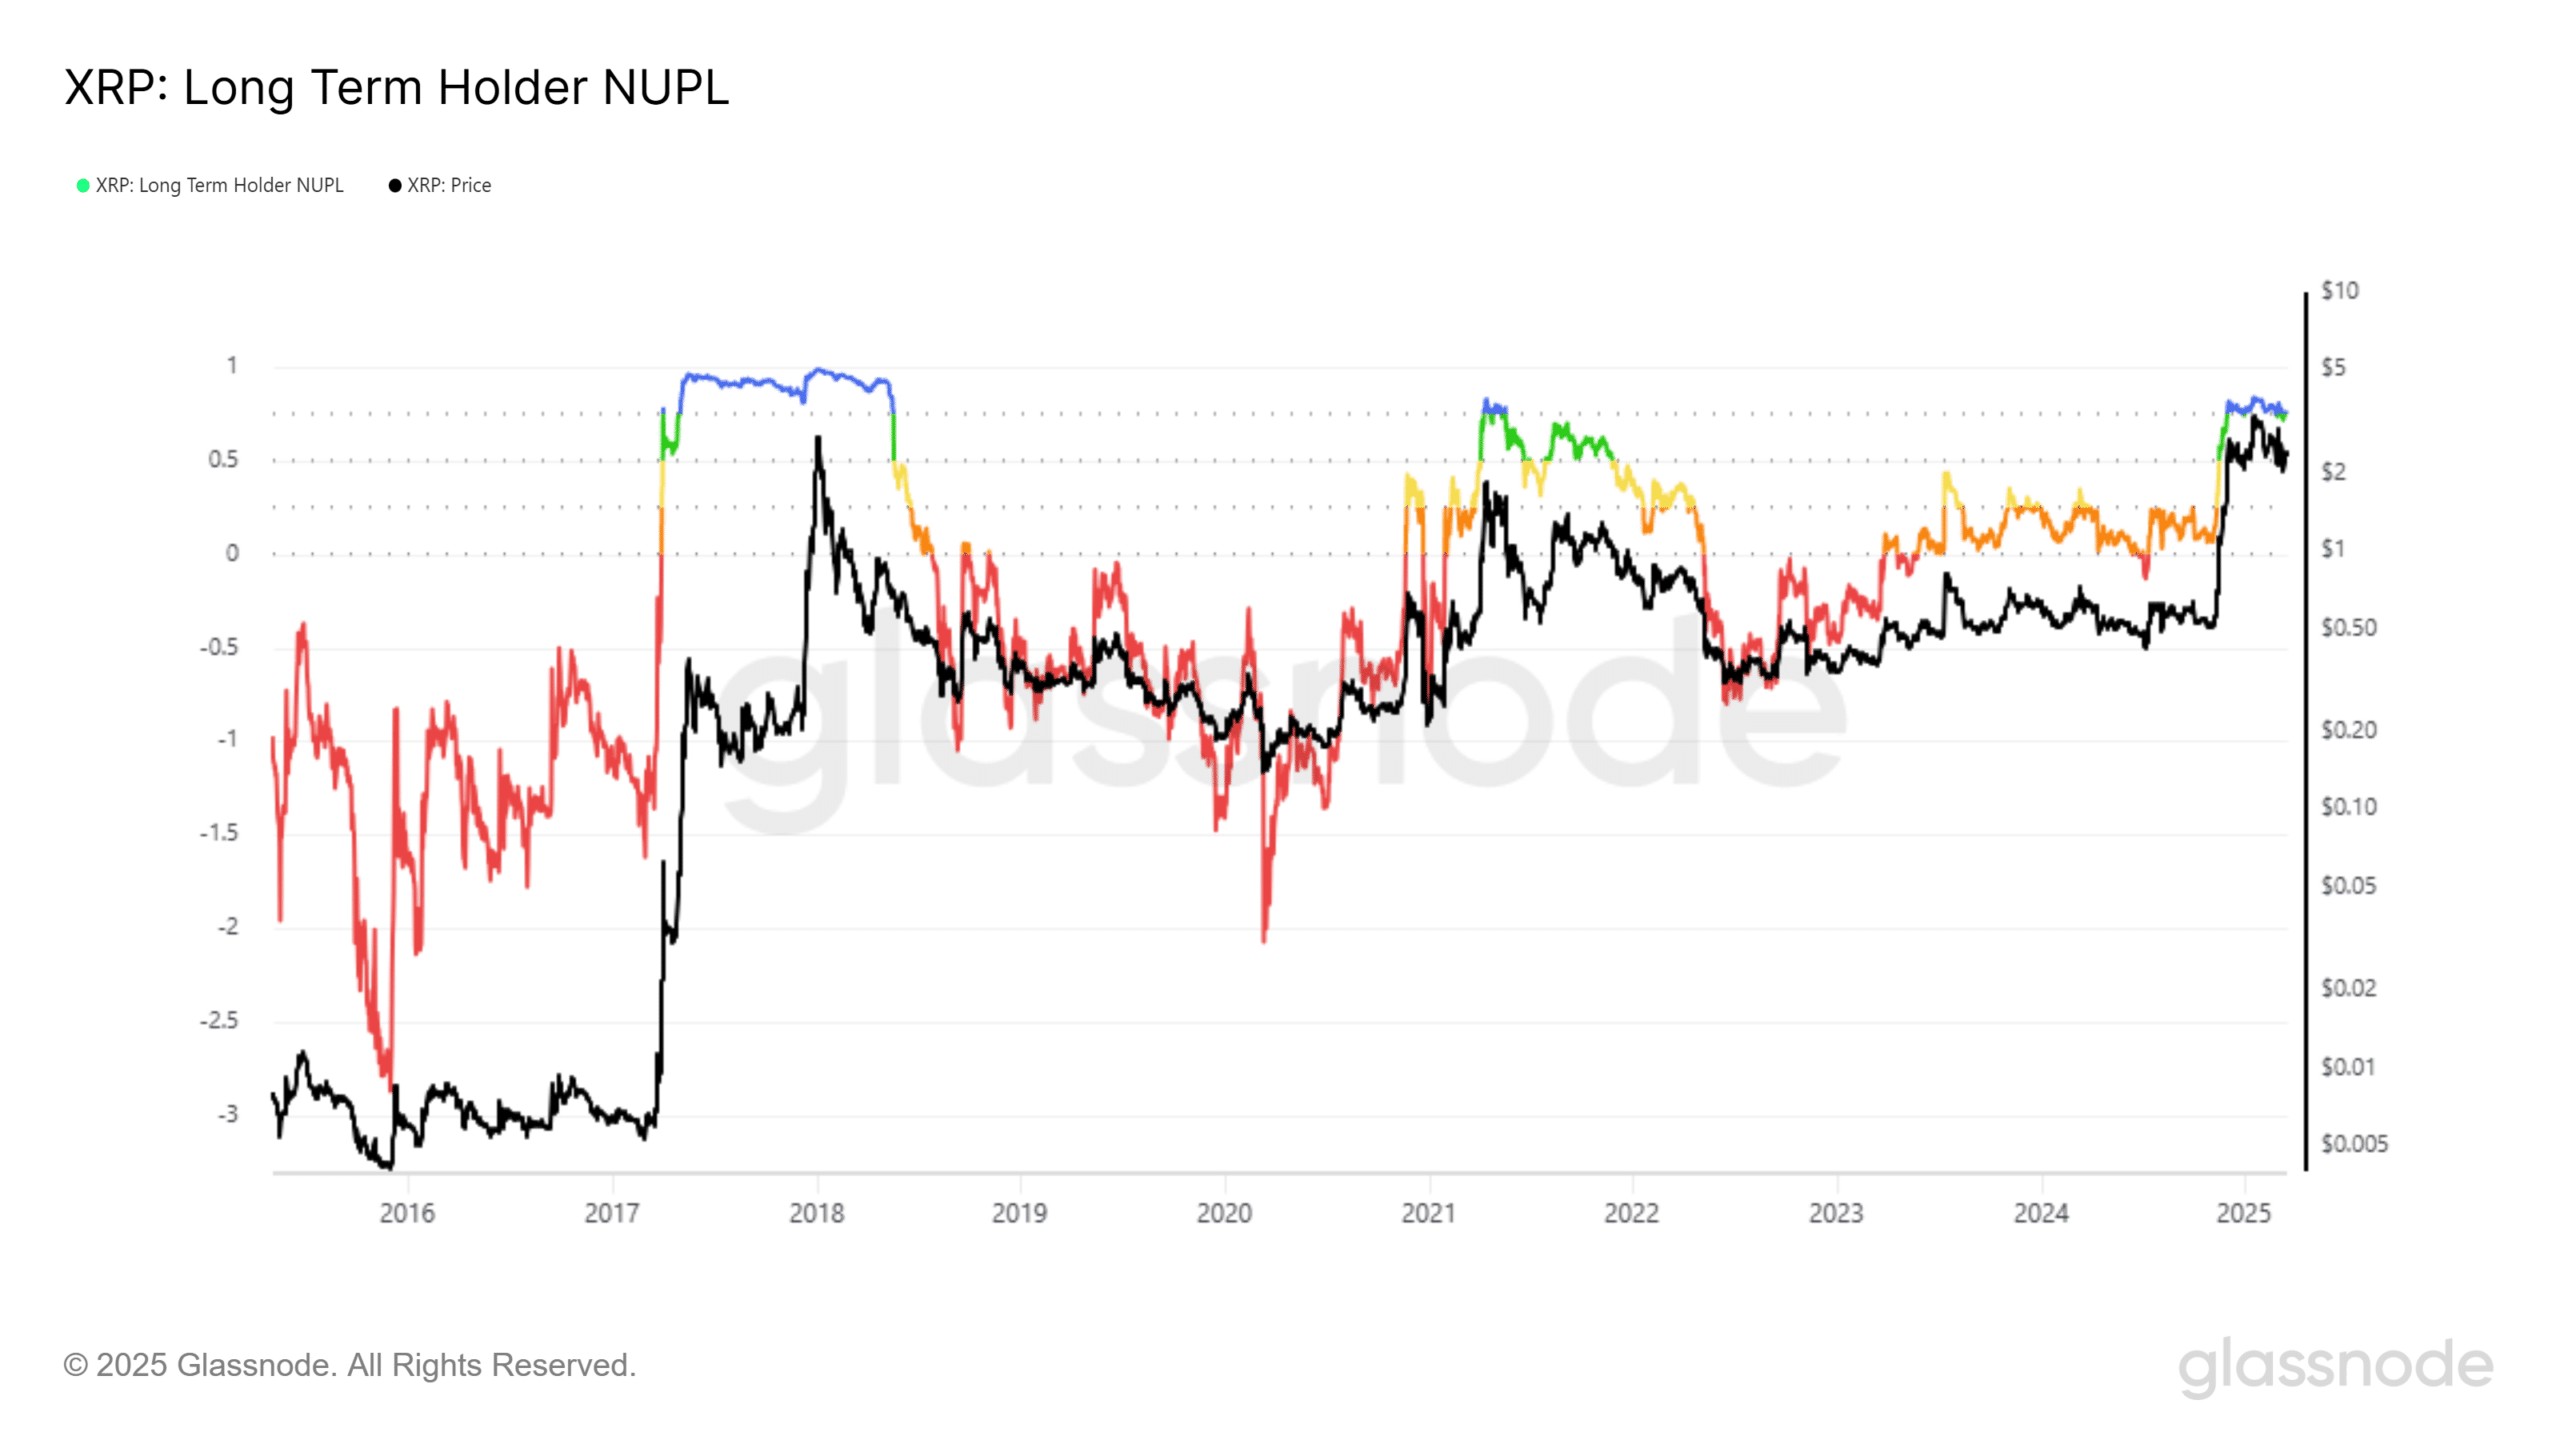
While Santiment’s metrics showed hike in on-chain activity and potential demand, the long-term holder net unrealized profit-loss (LTH NUPL) highlighted euphoria/greed in the market. Over the past few months, the metric has been hovering just above the 0.75-level.
Here, the NUPL measures the difference between unrealized profits and unrealized losses among holders whose tokens are at least 155 days old. Positive values imply that investors are, on average, profitable. A value of 0.75 meant that 75% of the market capitalization was in profit.
In the summer of 2021, the metric rose above 0.75 and marked the cycle top for XRP. In 2017, the metric surged beyond 0.9 and stayed there for weeks. However, back then, it was also a much younger asset.
XRP might have made its cycle top already. Investors should be looking to cash out their holdings partially in case the market begins to turn and sustains a downtrend for the next two years.