
- FTM’s network activity surged, with new addresses up 35% and active addresses rising 10%.
- FTM broke out of a descending symmetrical triangle but faces strong resistance at $0.56.
Fantom [FTM] showed signs of strength after breaking out of its descending symmetrical triangle.
FTM was trading at $0.5425, at press time, reflecting a 6% increase in the last 24 hours. On-chain data revealed significant growth in network activity, adding to bullish momentum.
Furthermore, the number of holders “in the money” has increased by 20.20%, meaning more investors are now in profit. However, key resistance levels still pose challenges that could determine the token’s next move.
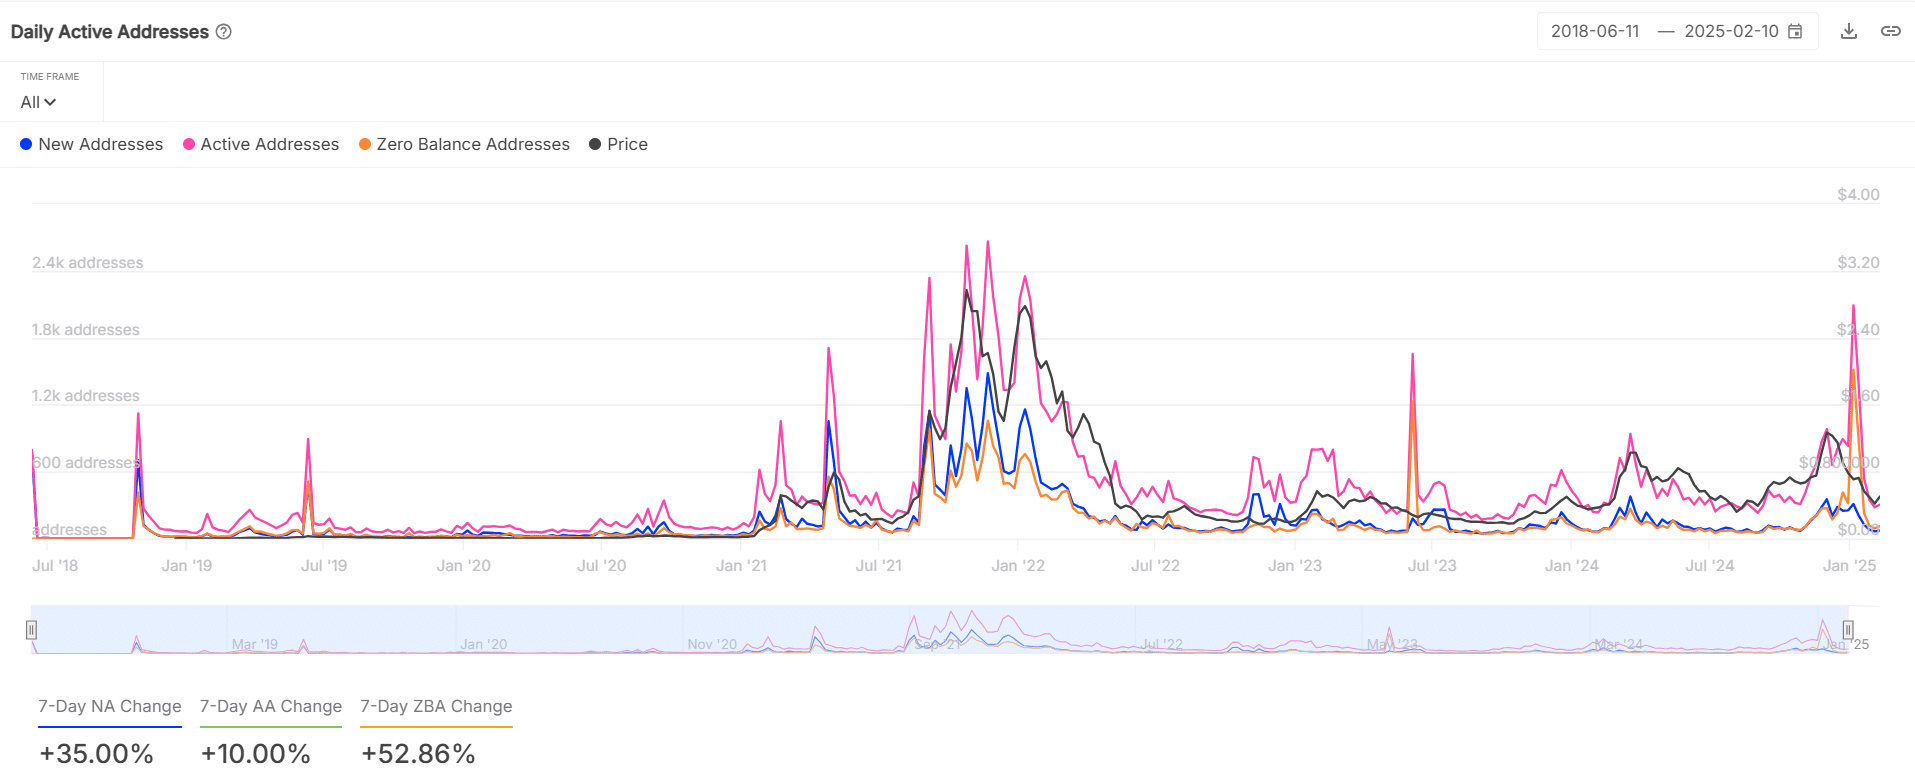
FTM addresses are growing, but is it enough?
At the time of writing, Network Activity on Fantom was surging, with New Addresses increasing by 35% in the past week. This signals growing adoption and user engagement, which is often a bullish indicator.
Additionally, Active Addresses have risen by 10%, reinforcing the network’s expansion. However, a 52.86% jump in Zero-Balance Addresses suggests some traders may be exiting or consolidating funds.
While this is a positive development, it could also lead to profit-taking, potentially slowing down FTM’s momentum. Sustained demand is crucial to maintaining its current trajectory.
Source: IntoTheBlock
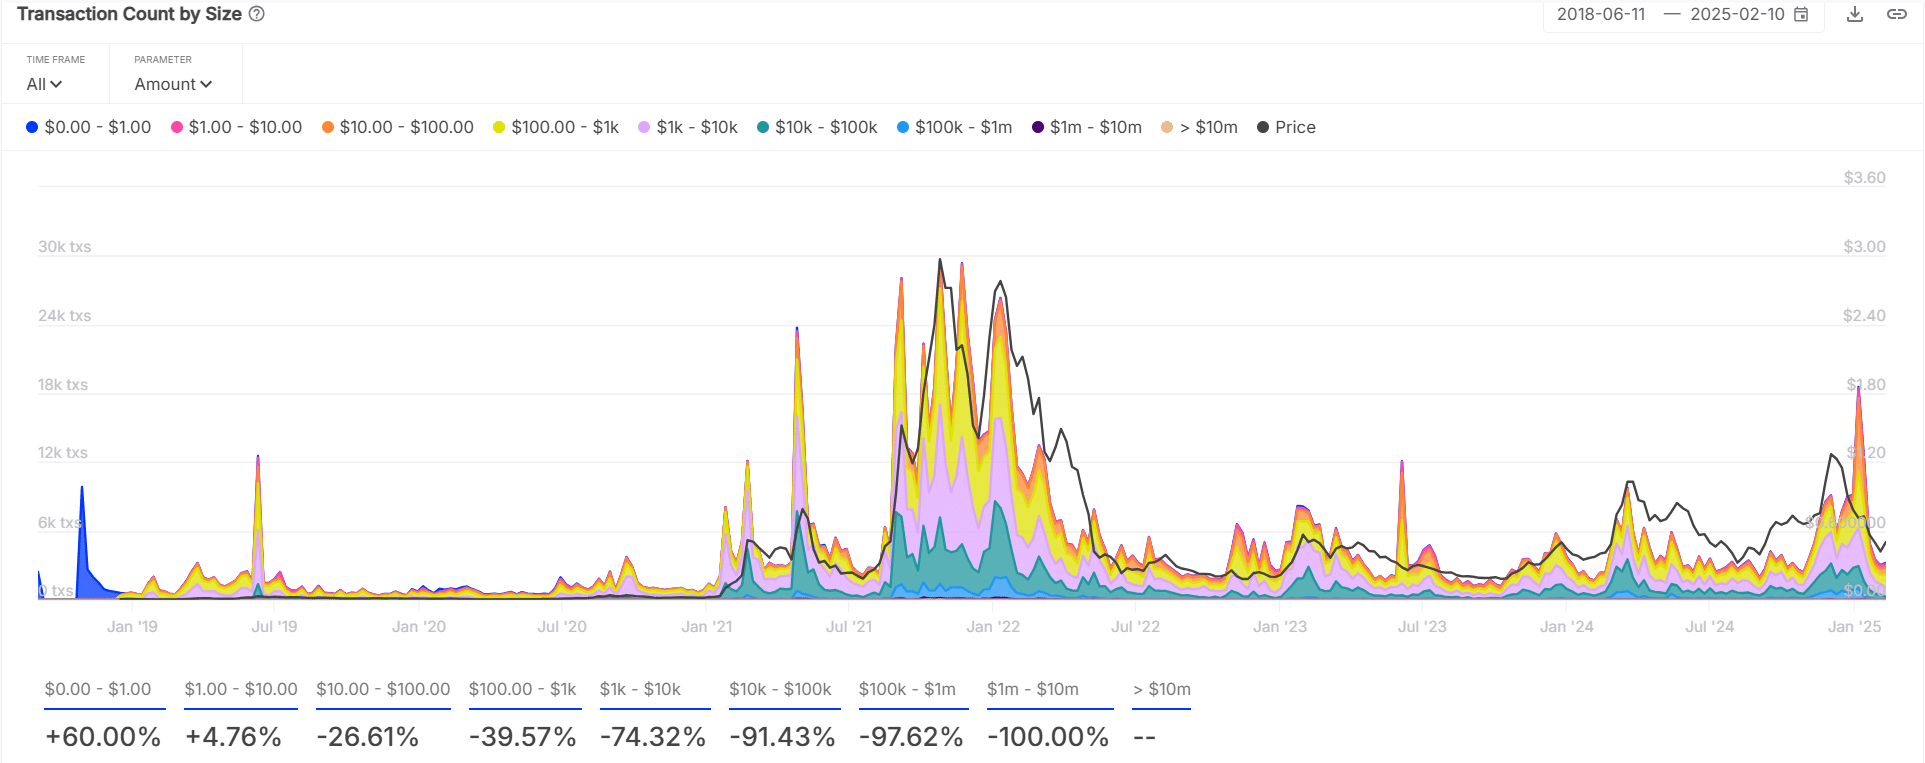
Transaction activity is shifting, but where are the whales?
Transaction data presents a mixed picture. Small transactions under $1 have surged by 60%, indicating increased retail activity. Additionally, transactions between $1 and $10 have grown by 4.76%, suggesting an influx of smaller investors.
However, mid-sized transactions between $10 and $100k have declined, showing that larger players are currently less active.
Meanwhile, transactions exceeding $1 million have disappeared entirely, falling by 100%. This shift indicates that institutional and high-net-worth investors are staying on the sidelines.
Source: IntoTheBlock
Fantom faces strong resistance; can it breakthrough?
FTM has successfully broken out of its descending symmetrical triangle, a bullish signal. The price is now testing crucial resistance at $0.56, which will determine its short-term direction. If it breaks through, the next major levels to watch are $0.85 and $1.43.
However, failure to hold above $0.56 could lead to a pullback toward $0.40-$0.45. Market momentum remains in favor of bulls, but resistance levels must be cleared for a sustained uptrend.
The coming days will be crucial for determining whether FTM will continue its climb or face rejection.

Source: TradingView
MVRV ratio declines; is profit-taking underway?
The MVRV Long/Short Difference has dropped sharply, signaling a shift in market sentiment. When this metric declines, it often indicates that traders who bought lower are now securing profits.
This could introduce selling pressure, making it harder for FTM to push higher.
Additionally, if profit-taking continues, the token may struggle to maintain its recent gains. However, if demand remains strong, buyers could absorb selling pressure and drive prices higher.

Source: Santiment
Can FTM sustain the rally?
Fantom shows strong bullish signals with rising network activity and a breakout from a key technical pattern. However, decreasing whale transactions and a declining MVRV ratio suggest caution.
If FTM flips $0.56 into support, it could push toward $0.85. Failure to do so may lead to a retracement.
The token’s ability to hold above resistance will determine its next move.