- AAVE’s accumulation phase gained traction following a sharp price drop.
- AAVE’s netflow trends, as illustrated by Coinglass data, provided further insight into market sentiment.
Aave [AAVE] has experienced significant price fluctuations, driven by market sentiment and accumulation trends. After reaching $400 in December 2024, the asset declined sharply, dipping below $200 in early 2025.
As accumulation strengthens and technical indicators signal momentum shifts, AAVE’s price trajectory remains at a critical juncture. This analysis explores the latest trends shaping AAVE’s outlook.

Source: Coinglass
Smart DEX Traders’ charts show AAVE entering an accumulation phase after a sharp price drop. On the AAVE/USDT 1-hour candlestick chart, the asset is trading at $193.31, reflecting a 0.75% decline.
The price range spans from a high of $194.19 to a low of $191.16, indicating selling pressure. The 10-period EMA at $185.73 remains below the 50-period EMA at $188.32, confirming a bearish trend.
Trading volume has spiked to 6.026M, indicating heightened activity. Meanwhile, the Cumulative Volume Delta (CVD) has dropped to -98.367K, reinforcing selling dominance.
However, the Rate of Change (ROC) at 9.10 and the MACD at 1.72 point to potential momentum shifts. If buying volume increases, AAVE could rebound toward $200.
On the other hand, continued selling pressure might drive the price below $180, potentially testing the $171.50 support level. Monitoring volume trends will be crucial for confirmation.
Cumulative Volume trends and price correlation
Further, the chart analyzed cumulative volume trends influencing AAVE’s price movement. Data from Smart DEX Traders showed cumulative volume peaking at 15K tokens in September 2024, coinciding with a price surge to $400.
As volume dropped to -10K in January 2025, AAVE’s price fell to $171.50. By March 2025, cumulative volume recovered to 5K, suggesting renewed accumulation.
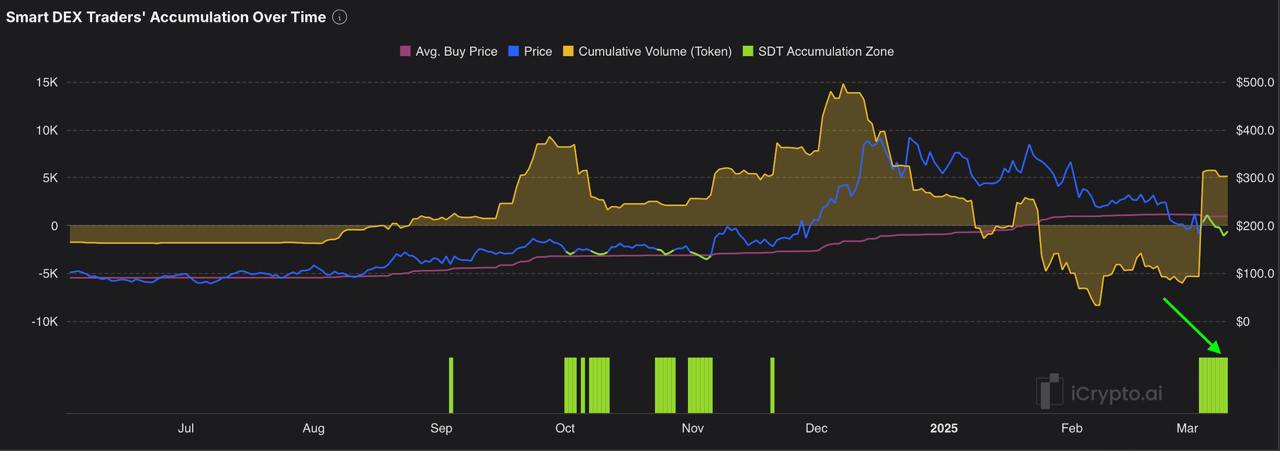
Source: ICrypto
The average buy price remained stable at $200 despite volatility. Accumulation zones, notably at $150 in August 2024, correlated with subsequent price recoveries.
Sustained volume at 5K indicated potential upward pressure toward $250. However, a drop below zero could signal a decline to $150, reflecting bearish sentiment.
Market sentiment suggests…
Moreover, AAVE’s netflow trends, as illustrated by Coinglass data, provided further insight into market sentiment. Netflow peaked at $15M in July 2024, aligning with a price rise to $300.
A significant outflow of -$20M in January 2025 coincided with AAVE’s decline to $171.13. By March 2025, netflow turned positive at $5M, suggesting renewed buying interest.
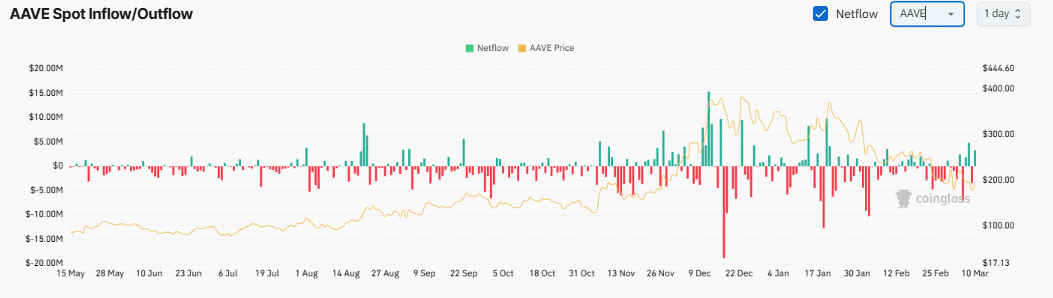
Source: Coinglass
In December 2024, consistent outflows of -$5M led to a significant price decline. A positive netflow of $5M indicated potential accumulation, suggesting prices could rise toward $200. However, a reversal to -$10M might drive prices below $150.
This pattern resembles September 2024, when a $10M inflow preceded a price rally. Monitoring netflow levels is essential, as inflows often signal the start of an uptrend and early indications of price reversals.
Rebound or further decline?
AAVE’s technical indicators and on-chain data point to a potential rebound if positive trends continue. On the 1-hour chart, AAVE is trading at $193.31, with a volume of 6.026M and a MACD of 1.72, signaling increasing momentum.
The cumulative volume of 5K in March 2025 aligns with past rallies, such as the $400 surge when volume reached 15K.
Additionally, a netflow of $5M offers a bullish signal following January’s -$20M outflow. If volume stays above 6M and netflow surpasses $10M, AAVE might climb toward $250.
Conversely, a volume drop below 3M or a negative netflow of -$5M could push prices down to $150, testing key support at that level. Historical trends, including the September 2024 volume spike, reinforce the bullish outlook.