
- The symmetrical triangle suggested a breakout targeting $0.00003255.
- Shiba Inu’s NVT Ratio dropped 2.3%, reflecting increased network activity.
Shiba Inu [SHIB] has drawn significant market interest as it formed a symmetrical triangle on the 4-hour chart.
This chart pattern often represents a phase of market uncertainty, but analysts anticipate an upward breakout in alignment with the broader cryptocurrency bull market.
AMBCrypto dives into the key elements shaping SHIB’s price movement and explores where it might head next.
Symmetrical triangle signals potential rally
SHIB was consolidating within a symmetrical triangle pattern, suggesting a period of indecision in the market.
The chart indicated a potential breakout, with a projected target price of $0.00003255, should the upward movement occur. This projection implies a possible 32% price increase from the current levels.
The symmetrical triangle, formed by converging support and resistance lines, represents a typical continuation or breakout pattern in technical analysis.
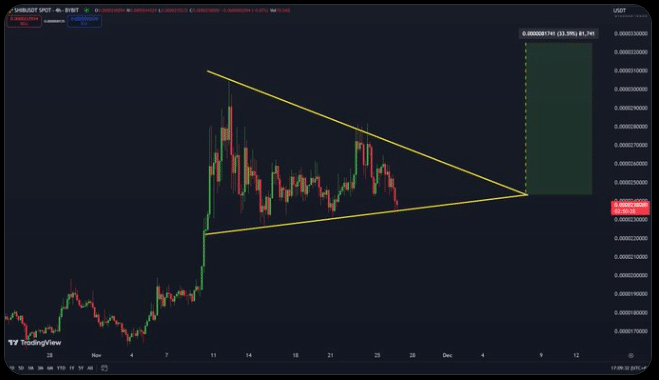
Source: TradingView
A decisive breakout above resistance could trigger bullish momentum, while a breakdown below support may result in further declines.
The 4-hour chart showed that Shiba Inu was consolidating within a narrow range, as indicated by the highlighted red zone. The price was hovering near $0.00002478, at press time, reflecting reduced volatility after a previous surge.
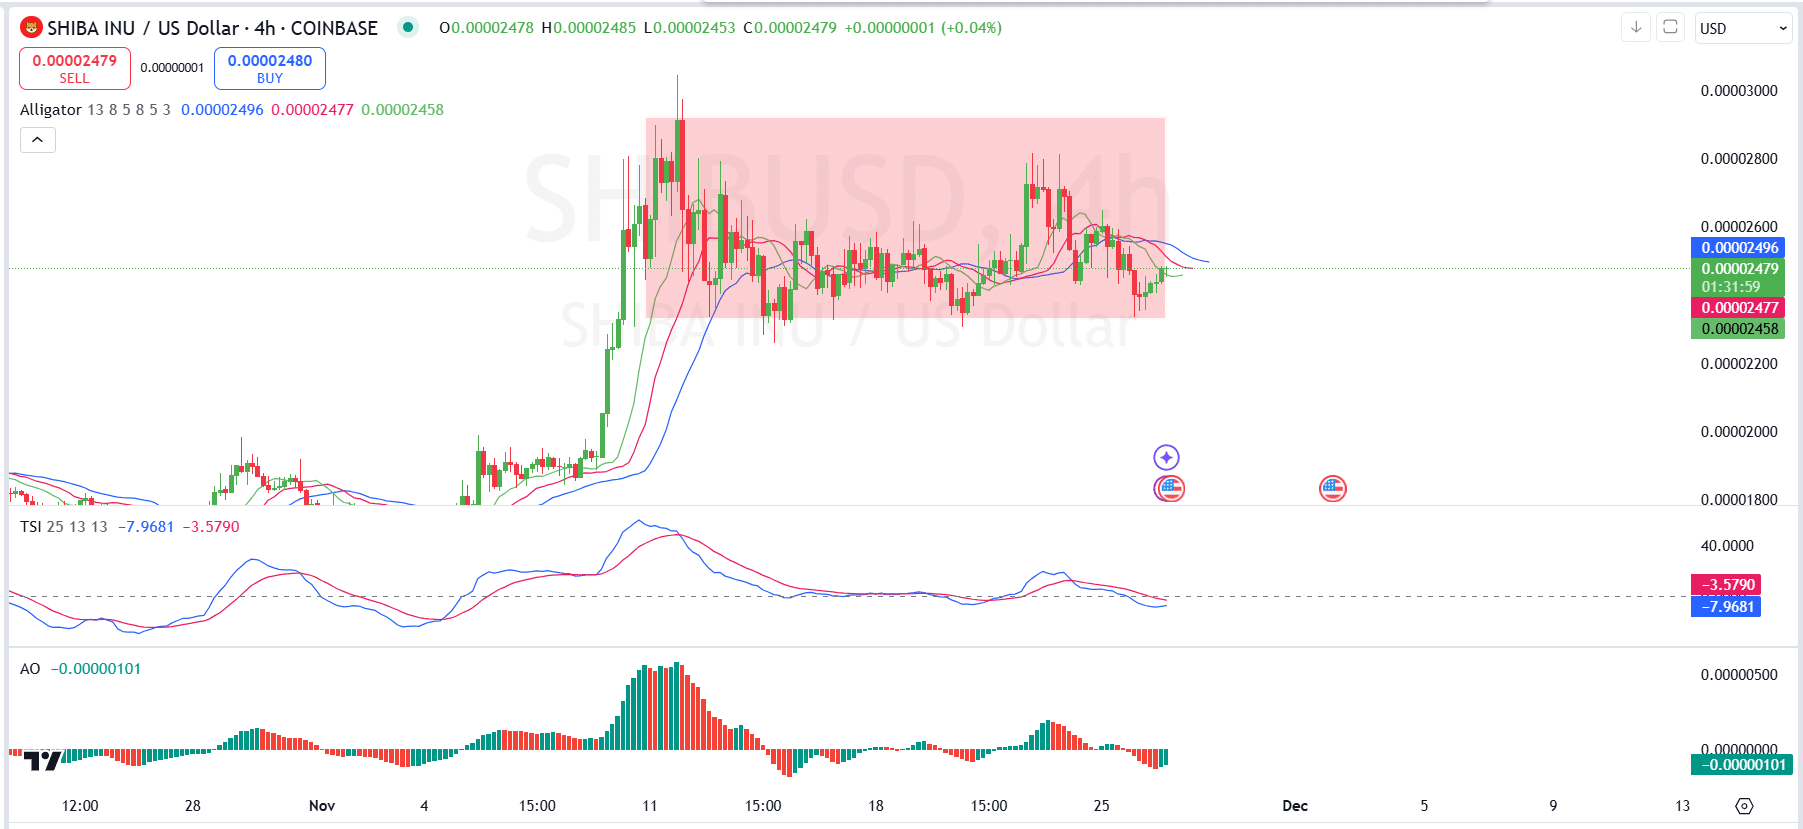
Source: TradingView
The Alligator indicator, with its three Moving Averages, revealed that the lines were converging, signaling a lack of clear directional momentum.
Additionally, the True Strength Index displayed bearish values at -3.5790 and -7.9681, suggesting sellers currently maintain control but with weakening pressure.
The Awesome Oscillator, with a negative value of -0.00000101, confirms a lack of bullish momentum.
SHIB at a key level between highs and lows
The MVRV ratio recently declined by 4.02% over the past 24 hours, indicating potential profit-taking or reduced market optimism.
MVRV was well below its 52-week high of 2.02 on the 6th of March 2024, suggesting the market is in a less speculative phase compared to peak periods.
Historically, the MVRV ratio reached an all-time high of 5.15 in October 2021, signaling highly overvalued conditions and subsequent corrections.
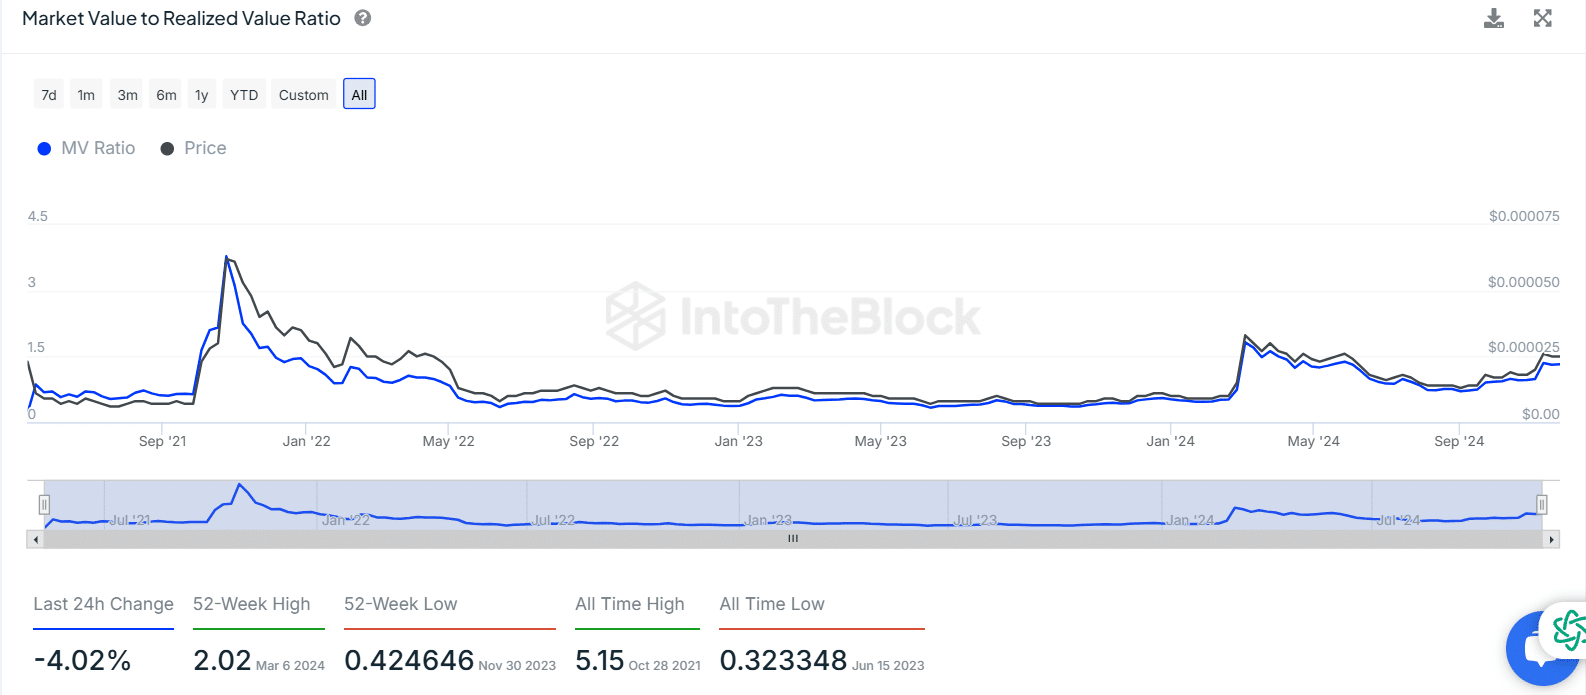
Source: IntoTheBlock
By contrast, the all-time low of 0.3233 in June 2023 coincided with undervalued conditions, presenting potential buying opportunities.
At present, the ratio hovers closer to neutral, implying neither extreme undervaluation nor overvaluation.
NVT ratio reflects increased network activity
Shiba Inu’s Network Value to Transaction (NVT) Ratio, alongside its price, provides insights into the asset’s valuation relative to its transaction volume.
The NVT ratio decreased by 2.30% in the last 24 hours, highlighting a slight increase in transaction activity compared to network value.
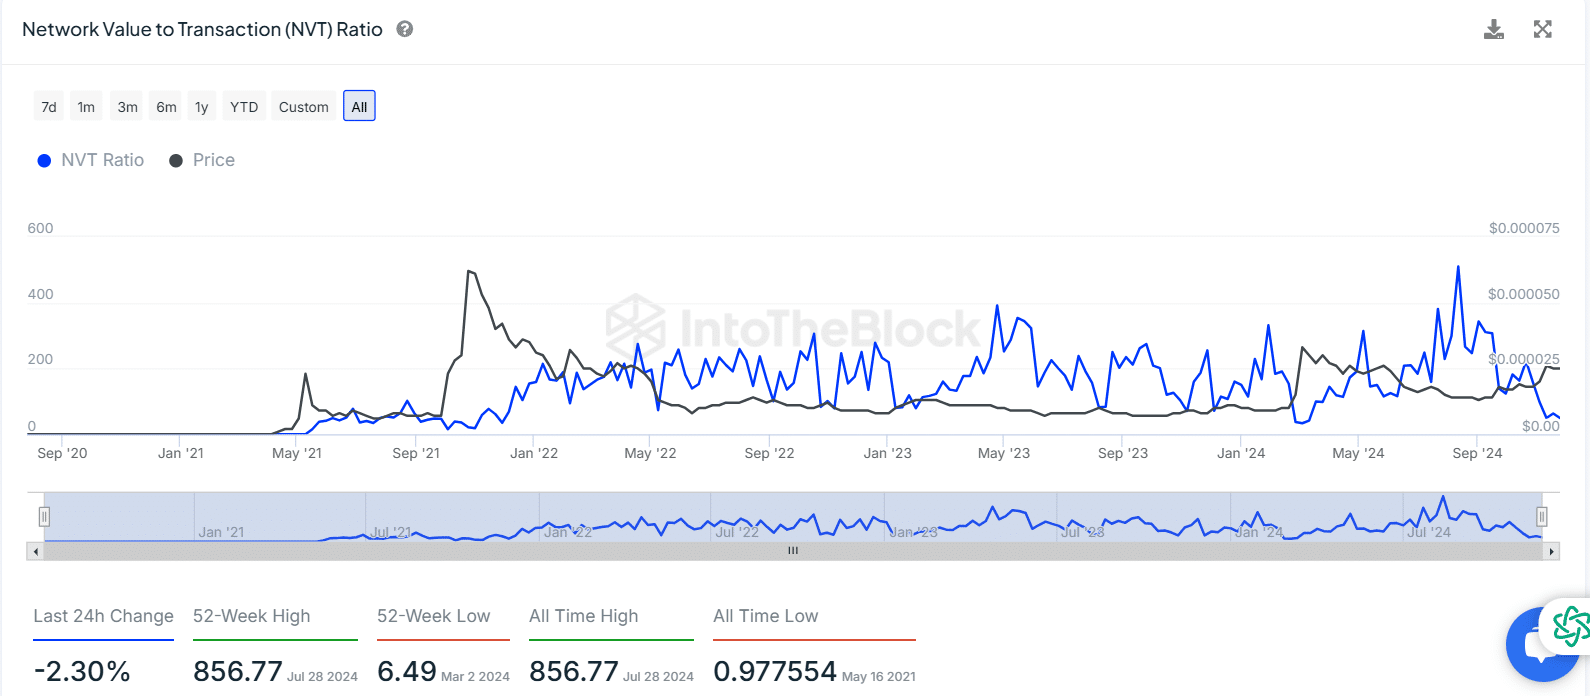
Source: IntoTheBlock
The ratio remains well below its 52-week high of 856.77 on the 28th of July 2024, reflecting a cooling phase from previously overvalued conditions.
Is your portfolio green? Check out the SHIB Profit Calculator
Data shows the historical significance of the NVT ratio, with an all-time high of 856.77 and a low of 0.9776.
High NVT values typically indicate overvaluation, while low values suggest undervaluation. Currently, the ratio is closer to neutral levels, indicating balanced transaction volumes relative to Shiba Inu’s market value.