In brief
- Another pro-crypto executive order from Donald Trump has markets feeling bullish again.
- Bitcoin got a modest bump, but altcoins like XRP, Ethereum, and Dogecoin are flying high.
- What happens next? Let’s take a look at the charts.
The cryptocurrency market regained some lost ground this week, with altcoins such as Ethereum, XRP, and Dogecoin leading the way among the majors with strong gains.
Bitcoin remained mostly flat on the week, with a modest 1% gain to above $116,000 over the last seven days. But the overall crypto market is once again making a push toward that elusive $4 trillion figure, and alts are again outpacing Bitcoin’s gains.
What accounts for the renewed optimism? Why, another Trump pump, of course.
President Donald Trump’s landmark executive order allowing alternative assets, including cryptocurrencies, in 401(k) retirement accounts has injected fresh confidence into digital assets.
The charts are now again flashing bullish signs, and the broader context of Trump’s executive order directing the Secretary of Labor to clarify the Department of Labor’s position on alternative assets and allowing for more permissive rules on crypto could provide the fundamental catalyst these technical setups need to resolve bullishly. With traditional markets showing volatility and commodities under pressure from trade tensions, cryptocurrencies may benefit from rotation as investors seek diversification opportunities.
So, with that in mind, let’s dive into the weekly numbers:
Ethereum (ETH): Breaking above resistance
It will be music to ears of Ethereum maxis everywhere that the charts confirm what they are now feeling: the bullish vibe are back.
Ethereum is showing a strong technical setup when compared to other major cryptocurrencies, currently trading above $4,000—for the first time in eight months—with bullish momentum building across multiple timeframes. ETH is up 13% since this time last week, and it appears to only be getting started.
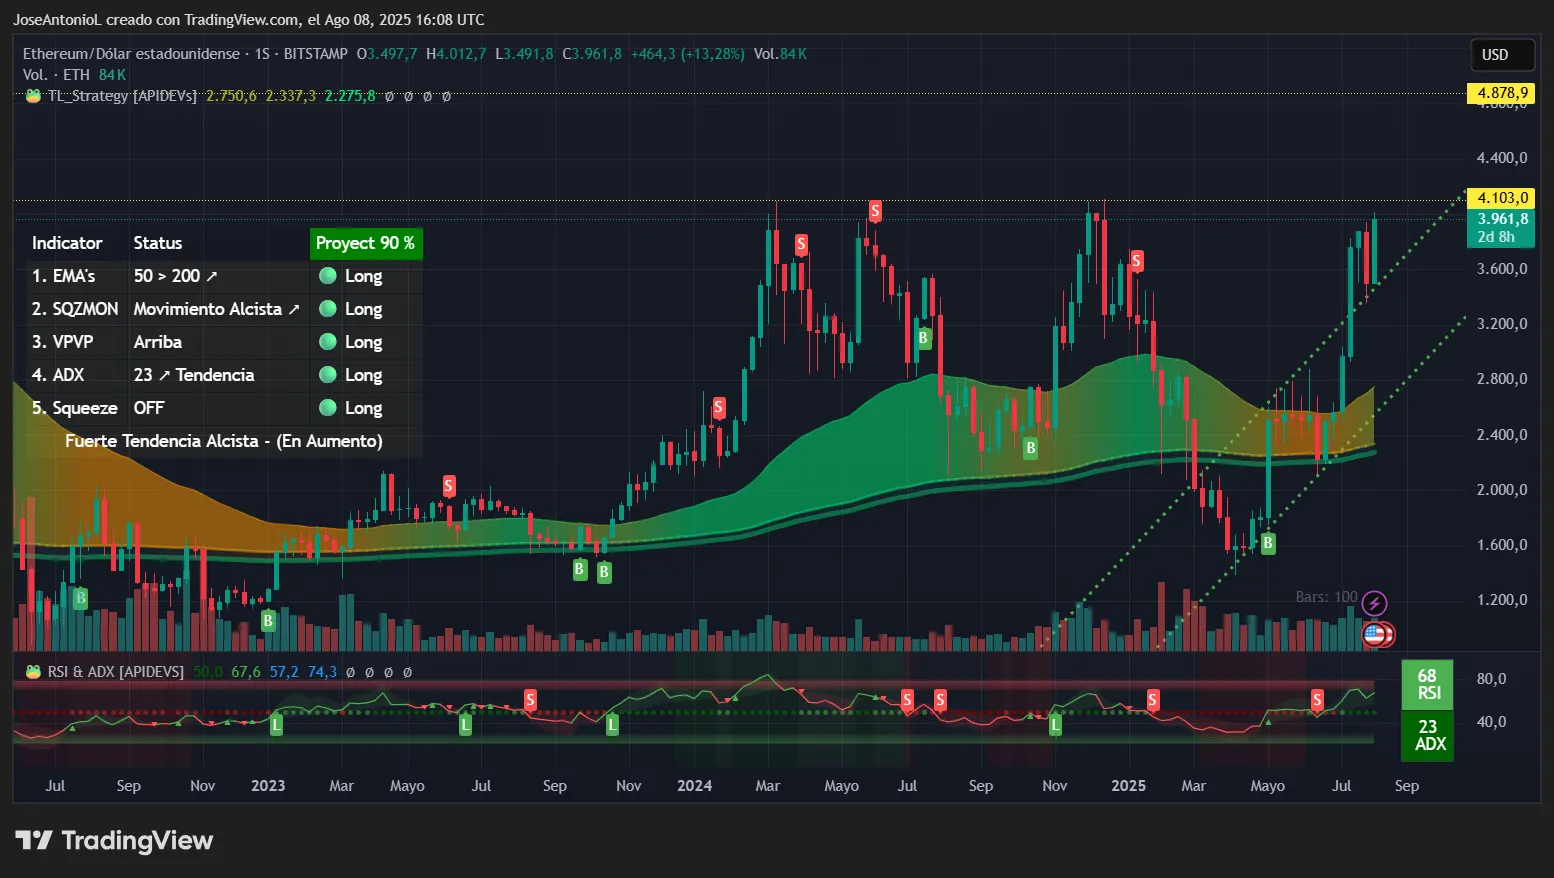
The Average Directional Index, or ADX, for Ethereum is at 23, approaching the crucial 25 threshold. ADX measures trend strength on a scale of 0-100, where readings above 25 confirm a strong trend is developing. Traders watch this level closely as it often marks the transition from sideways trading to sustained directional movement. The rising ADX suggests Ethereum’s recent strength could evolve into a more persistent uptrend, as it cancels the losses from a multi-month correction that tanked its price from December 2024 all the way to April 2025.
Ethereum’s Exponential Moving Averages, which consider the average price of the asset over a given period of time, also paint an increasingly bullish picture. The 50-week EMA (the average price over roughly a year of price movement) provides solid support well below current prices, and the 200-week EMA sits even lower. This configuration—where shorter-term averages trade above longer-term ones—typically signals sustained buying pressure that traders interpret as confirmation of an uptrend. The widening gap between these averages suggests strengthening momentum.
The Relative Strength Index, or RSI, for ETH is at 68, approaching overbought territory above 70, but not quite reaching it yet. RSI measures how hot or cold a market might be, likewise on a scale from 0 to 100. An RSI of 68 indicates strong buying momentum without yet triggering profit-taking that often occurs above 70 from algorithmic trading setups. Historically, Ethereum can sustain RSI readings between 65-75 for extended periods during bull runs, suggesting more upside is possible before exhaustion sets in.
The Squeeze Momentum Indicator shows that that volatility has already been released from a previous compression phase in May. Theoretically, this means the current move has room to continue as the market isn’t yet showing signs of another consolidation period forming.
In the medium and long term, all indicators point to a sustained bullish recovery. The prices broke past the resistance of an already bullish channel (the dotted green lines in the above chart) indicating that investors were willing to add even more fuel to the slow recovery. Last week’s prices corrected to the downside and this price line acted as a price support zone now.
Traders are so bullish that on Myriad, a prediction market built by Decrypt’s parent company Dastan, 60% of predictors expect ETH to hit $5,000 this year. That’s a 30% jump from today’s prices. What’s more, a whopping 70% of Myriad users expect a new ETH all time high, above $4,800, this year.
Key Levels:
- Immediate support: $3,600
- Strong support: $3,200
- Immediate resistance: $4,103
- Strong resistance: $4,400
XRP: Consolidating above critical support
Another group dancing in the streets today is the XRP Army, the community of XRP true believers that have continued to hold on throughout the ups and downs. Lately, there have been a lot more ups.
XRP is currently trading at $3.23 maintaining position above the psychologically important round number of $3, with mixed but ultimately positive technical signals. The Ripple-linked cryptocurrency is up 9.79% this week.
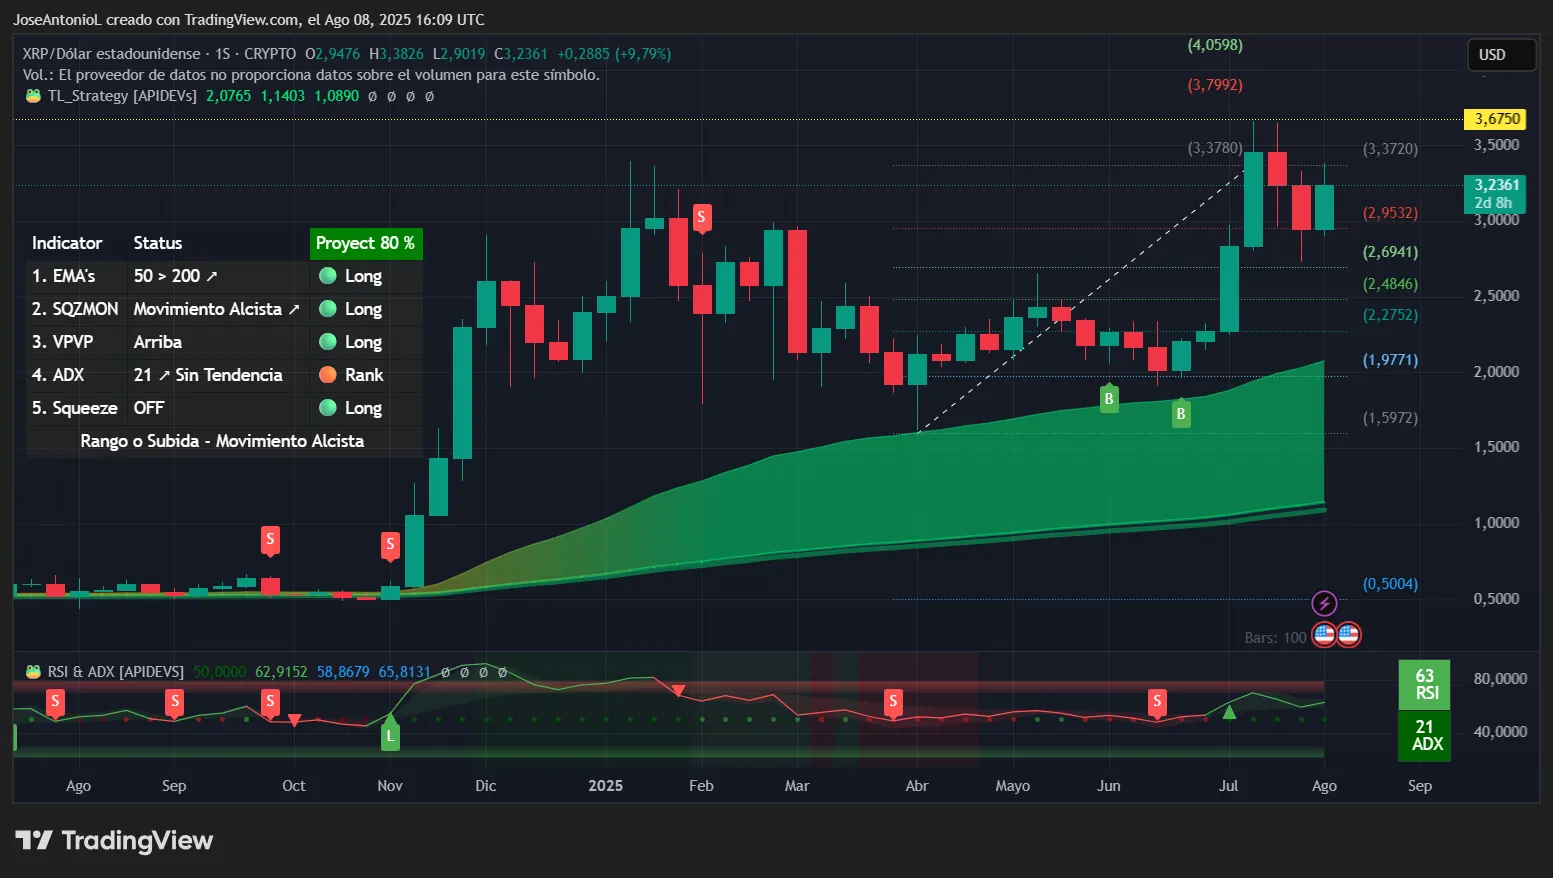
XRP’s ADX recovered some ground this week, now sitting at 21 points. This suggests the market is in transition. This “no man’s land” reading indicates XRP is building energy for its next directional move—traders often see this as a coiled spring scenario where the eventual breakout could be significant.
Considering the major spike in XRP’s price between late 2024 and early 2025, this is to be expected as markets cool down and digest the massive move. Now, the price trend shows more equilibrium without losing its broader bullish trajectory.
The 50-200 EMA setup shows a heavily bullish gap—which is expected considering how low prices were in the last four years. The fact that XRP’s price trades above both averages is something traders would say is definitively bullish, indicating buyers are in control across multiple timeframes. The gap between the averages is also increasing, which means traders may expect a steady movement to the upside.
The RSI at 63 places XRP in what traders call the “power zone”—strong enough to indicate genuine momentum without pointing to FOMO. Based on this indicator alone, there is still room for XRP to grow before a major correction in the weekly charts.
The Squeeze Momentum Indicator’s “off” status confirms we’re in an active trend phase. Combined with the ADX reading, this double confirmation of trend activity gives traders confidence that moves in either direction will likely be significant but not explosive.
Key Levels:
- Immediate support: $3
- Strong support: $2,69
- Immediate resistance: $3,372
- Strong resistance: $3,67
Dogecoin (DOGE): Range-bound with neutral signals
Dogecoin aficionados also have reason to celebrate—but they should be careful not to celebrate too early.
Dogecoin shows the most neutral technical setup at $0.2216, reflecting a market in equilibrium after recent volatility, but experienced a price recovery strong enough to rank third on the list of best-performing cryptocurrencies in the top 10 by market cap. DOGE is now up 11.5% in the last seven days.
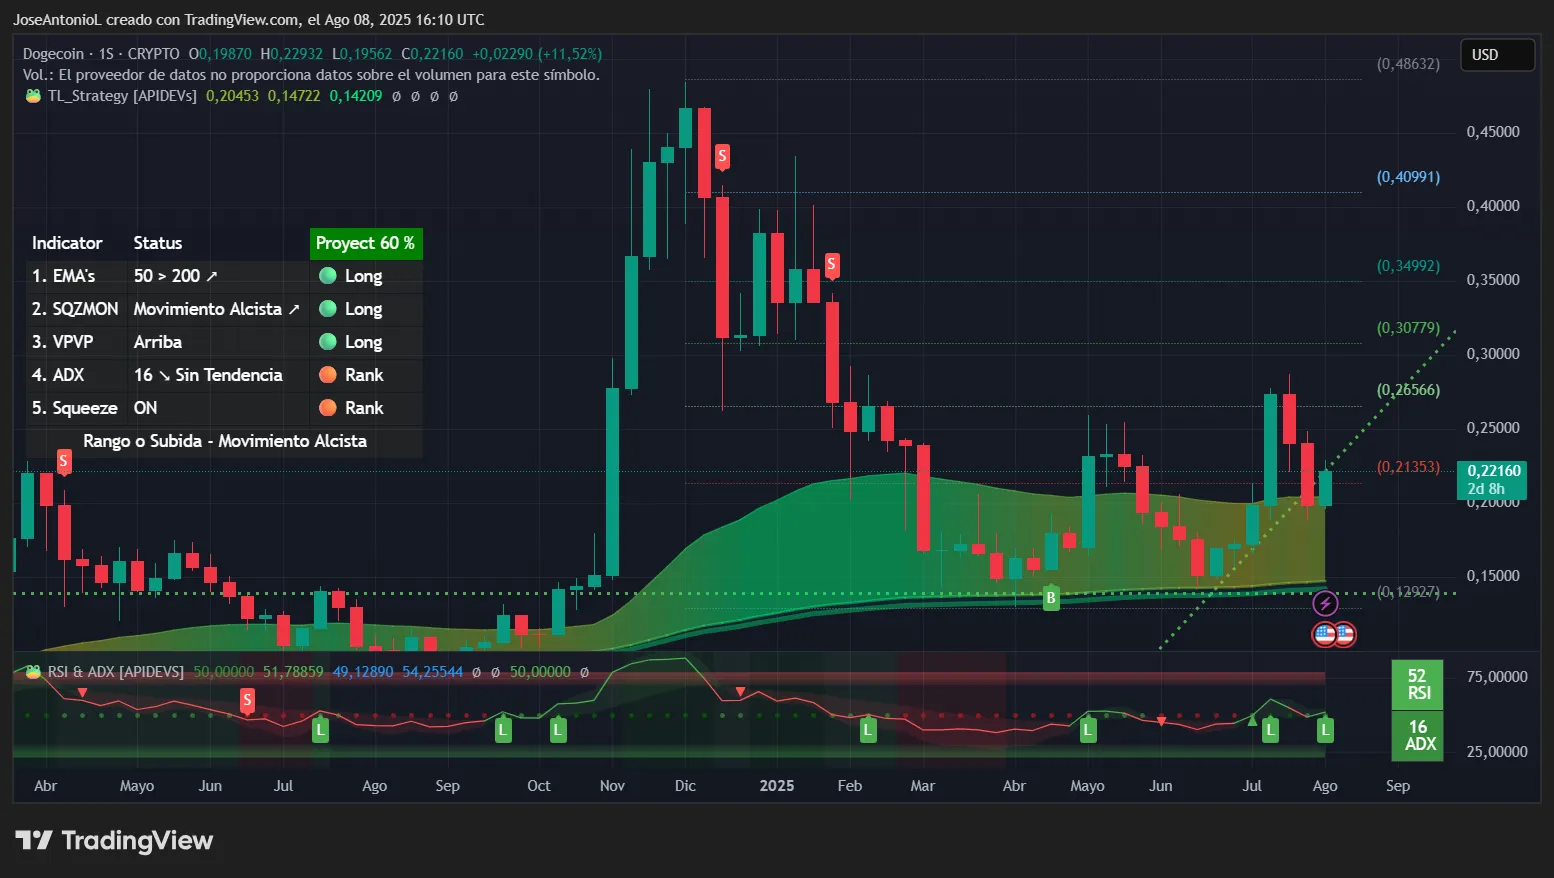
The ADX at 16 indicates no clear trend. Readings below 20 typically suggest choppy, directionless trading that frustrates both bulls and bears. DOGE is recovering from a heavy drop, which means any upward movement right now is more likely to be interpreted as a weakening of bearish trend rather than the establishing of a bullish one. But that also means this could be a period where smart money accumulates positions before the next trending phase begins.
The EMA configuration shows DOGE trapped between converging averages, creating what technical analysts call a “squeeze play.” The 50-week and 200-week EMAs are relatively close together and moving in tandem, indicating neither bulls nor bears have decisive control. This compression often resolves with explosive moves once a catalyst emerges, making DOGE a potential volatility play for traders watching for breakouts.
The RSI at 52 couldn’t be more neutral if it tried—sitting almost exactly at the midpoint between oversold (30) and overbought (70). This reading suggests perfect equilibrium between buying and selling pressure with markets trading sideways.
In terms of price patterns, Dogecoin is showing a clear double bottom pattern—a price movement that forms a “W” shape on the chart—which traders would say is very bullish if confirmed. The last leg is respecting a support, so the pattern has not been broken. The coin tried to cancel this last week with a bearish movement, but the pattern proved strong enough and this week’s recovery puts prices back into the support zone.
The Squeeze Momentum Indicator showing “on” status is particularly significant. If other coins show that the squeeze phase is off, Dogecoin’s technicals point to a period of market pressure that is likely to finish with a major movement either up or down. Considering the current pattern in formation, it’s more likely than not to be a bullish jump as the double-bottom pattern suggests.
Key Levels:
- Immediate support: $0.1950
- Immediate resistance: $0.2656
- Strong resistance: $0.3077
Disclaimer
The views and opinions expressed by the author are for informational purposes only and do not constitute financial, investment, or other advice.
Daily Debrief Newsletter
Start every day with the top news stories right now, plus original features, a podcast, videos and more.