
- Bitcoin’s 24H cumulative net taker volume enters green territory after weeks of sell-side dominance.
- Despite short-term optimism, long-term taker flows remain negative, signaling caution for a full trend reversal.
Bitcoin [BTC] appears to be regaining strength as selling pressure from aggressive takers continues to decline. With no major macro headwinds in sight, BTC may be on course for moderate growth this week.
How sustainable is the rally?
24-hour net taker volume shows bullish transition
Bitcoin’s Cumulative Net Taker Volume – 24H has seen a notable shift over the last month.
This metric, which measures the aggressiveness of market participants, had spent much of February deep in negative territory — with net taker volume plunging as low as -$1B.
However, in recent days, the cumulative figure has moved back into positive territory. This transition suggests that aggressive buyers have started dominating the market again after weeks of heavy sell-side control.
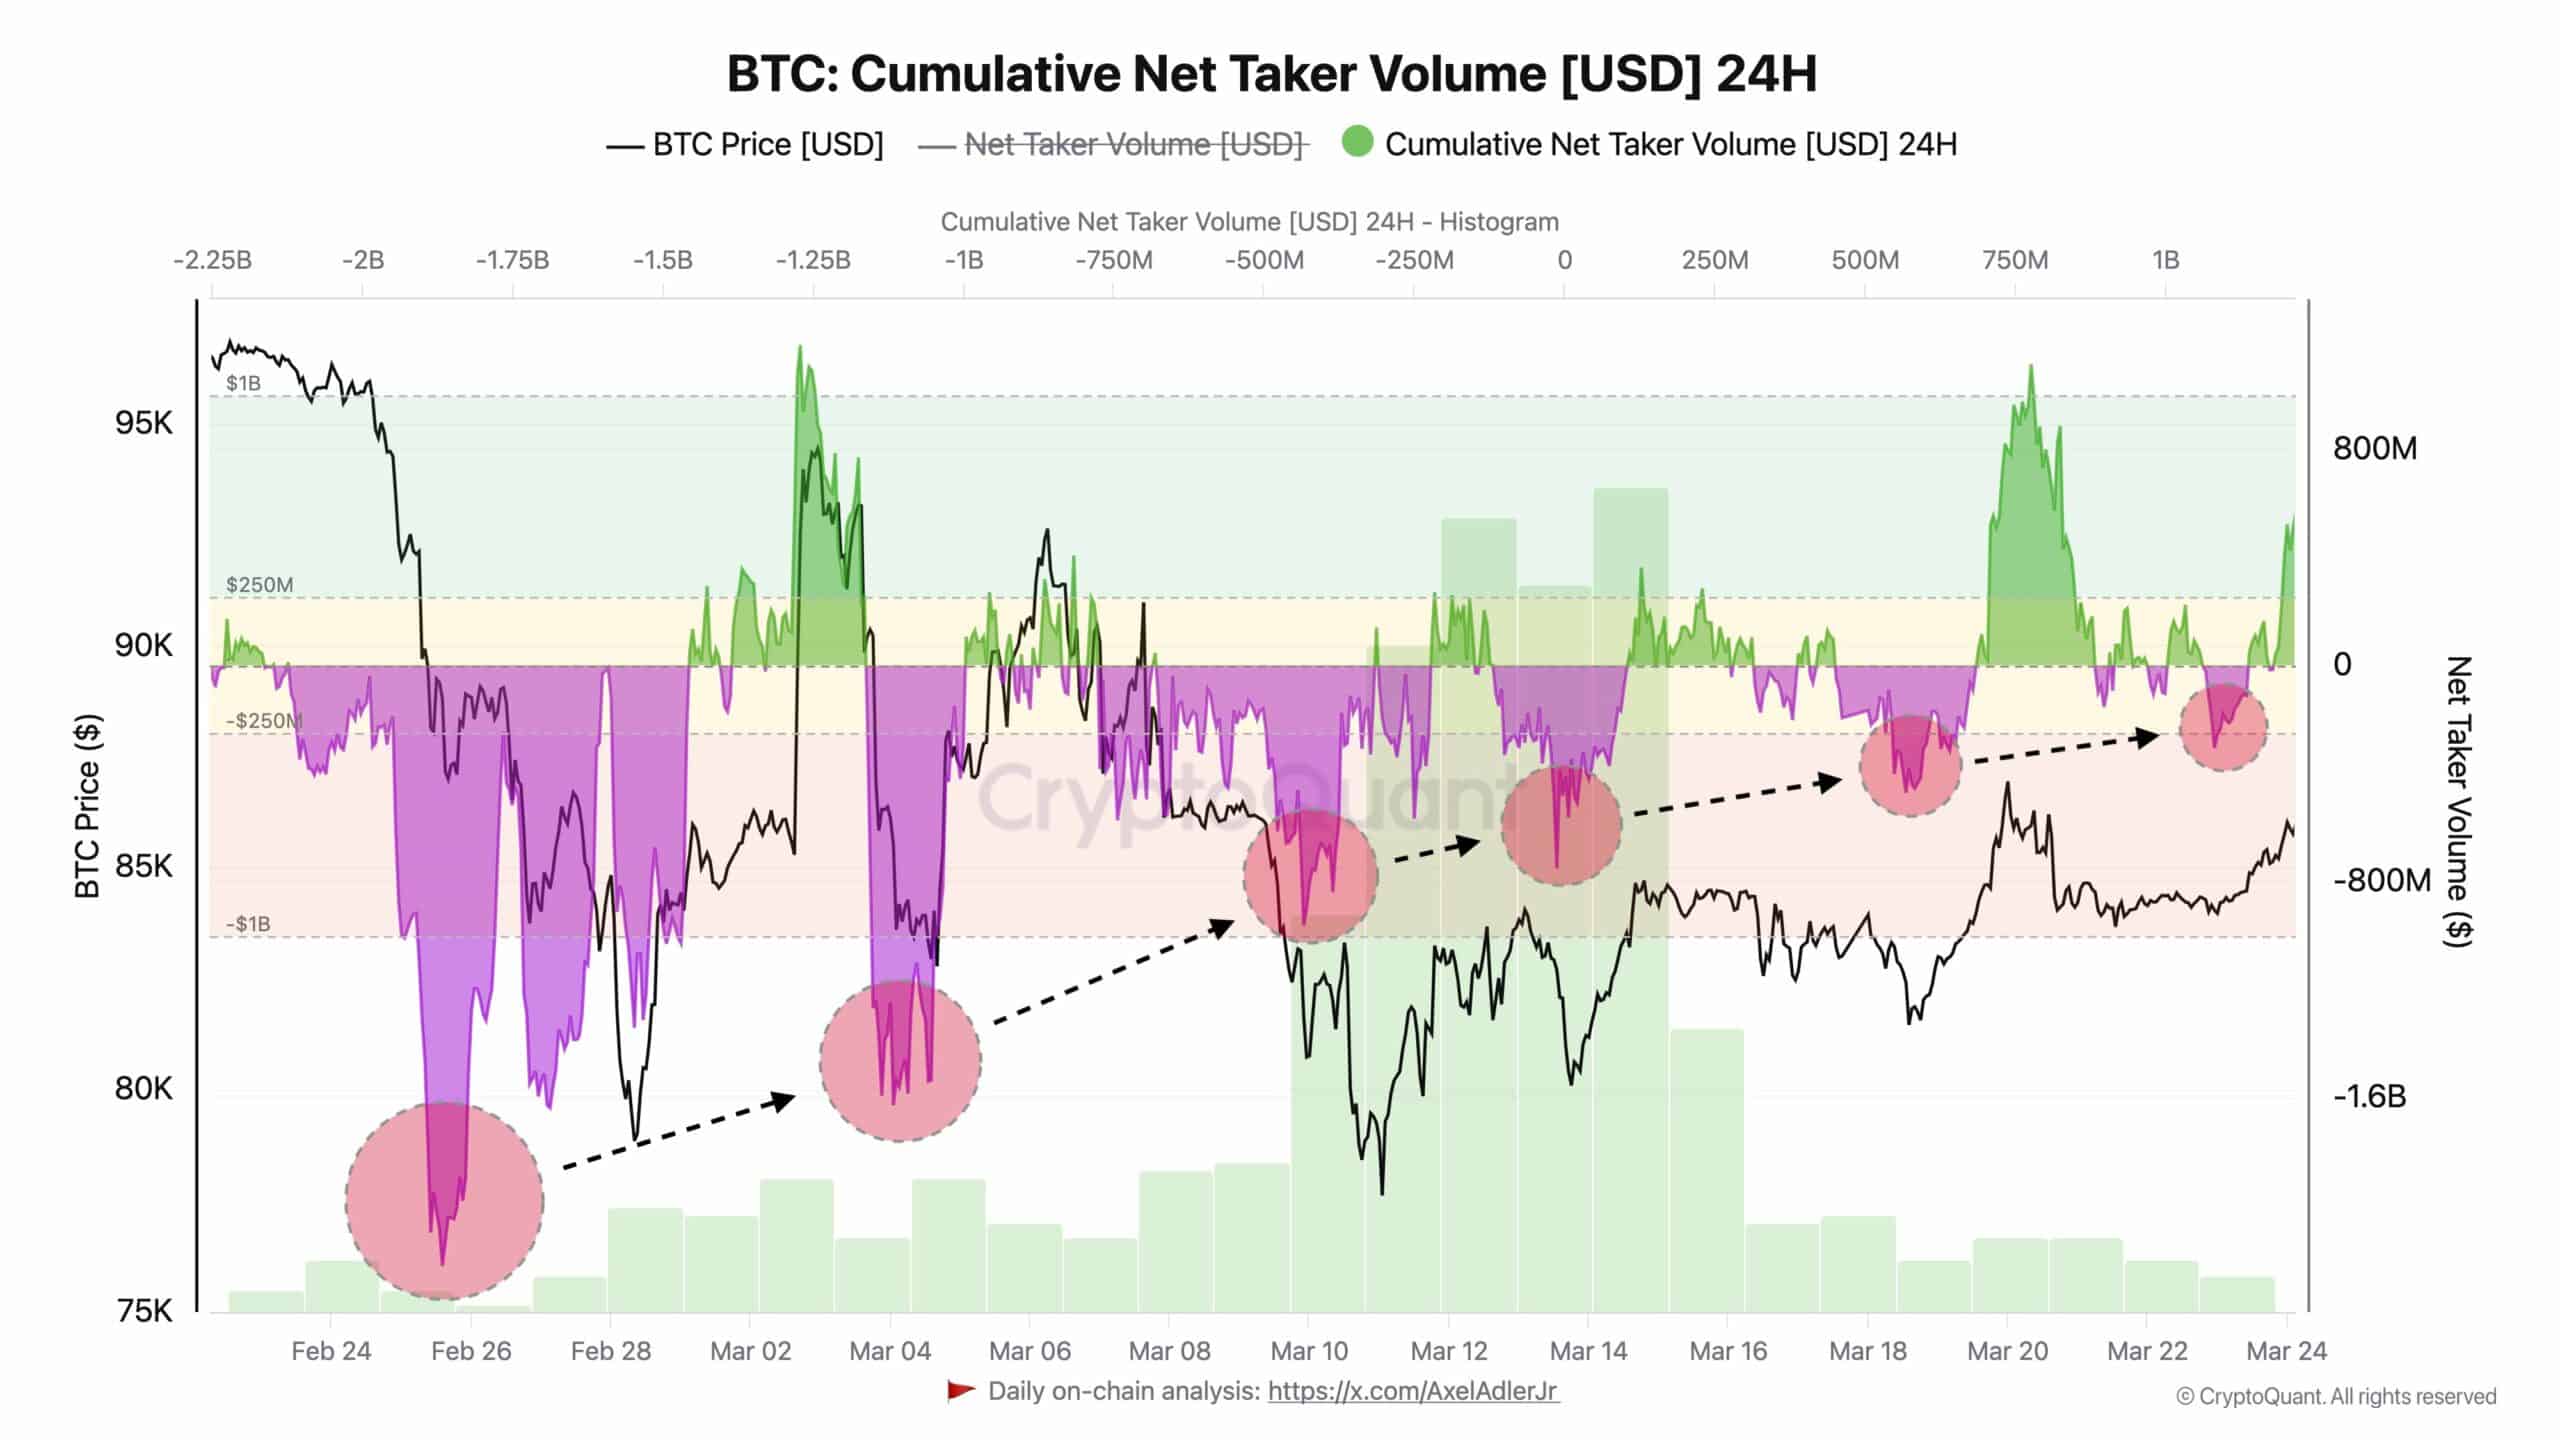
Historical patterns indicate that every time this metric shifts from negative to positive, BTC’s price tends to respond with a gradual uptrend.
The most recent uptick aligns with BTC’s ongoing recovery from sub-$80K levels to over $87K.
Long-term Bitcoin Net Taker volume still bears scars of selling
While the 24-hour metric flashes bullish signals, the longer-term Net Taker Volume – 30-day moving average offers a more tempered outlook.
This chart shows that negative net taker flows dominate the broader trend, with persistent red bars indicating the cumulative pressure from sellers.
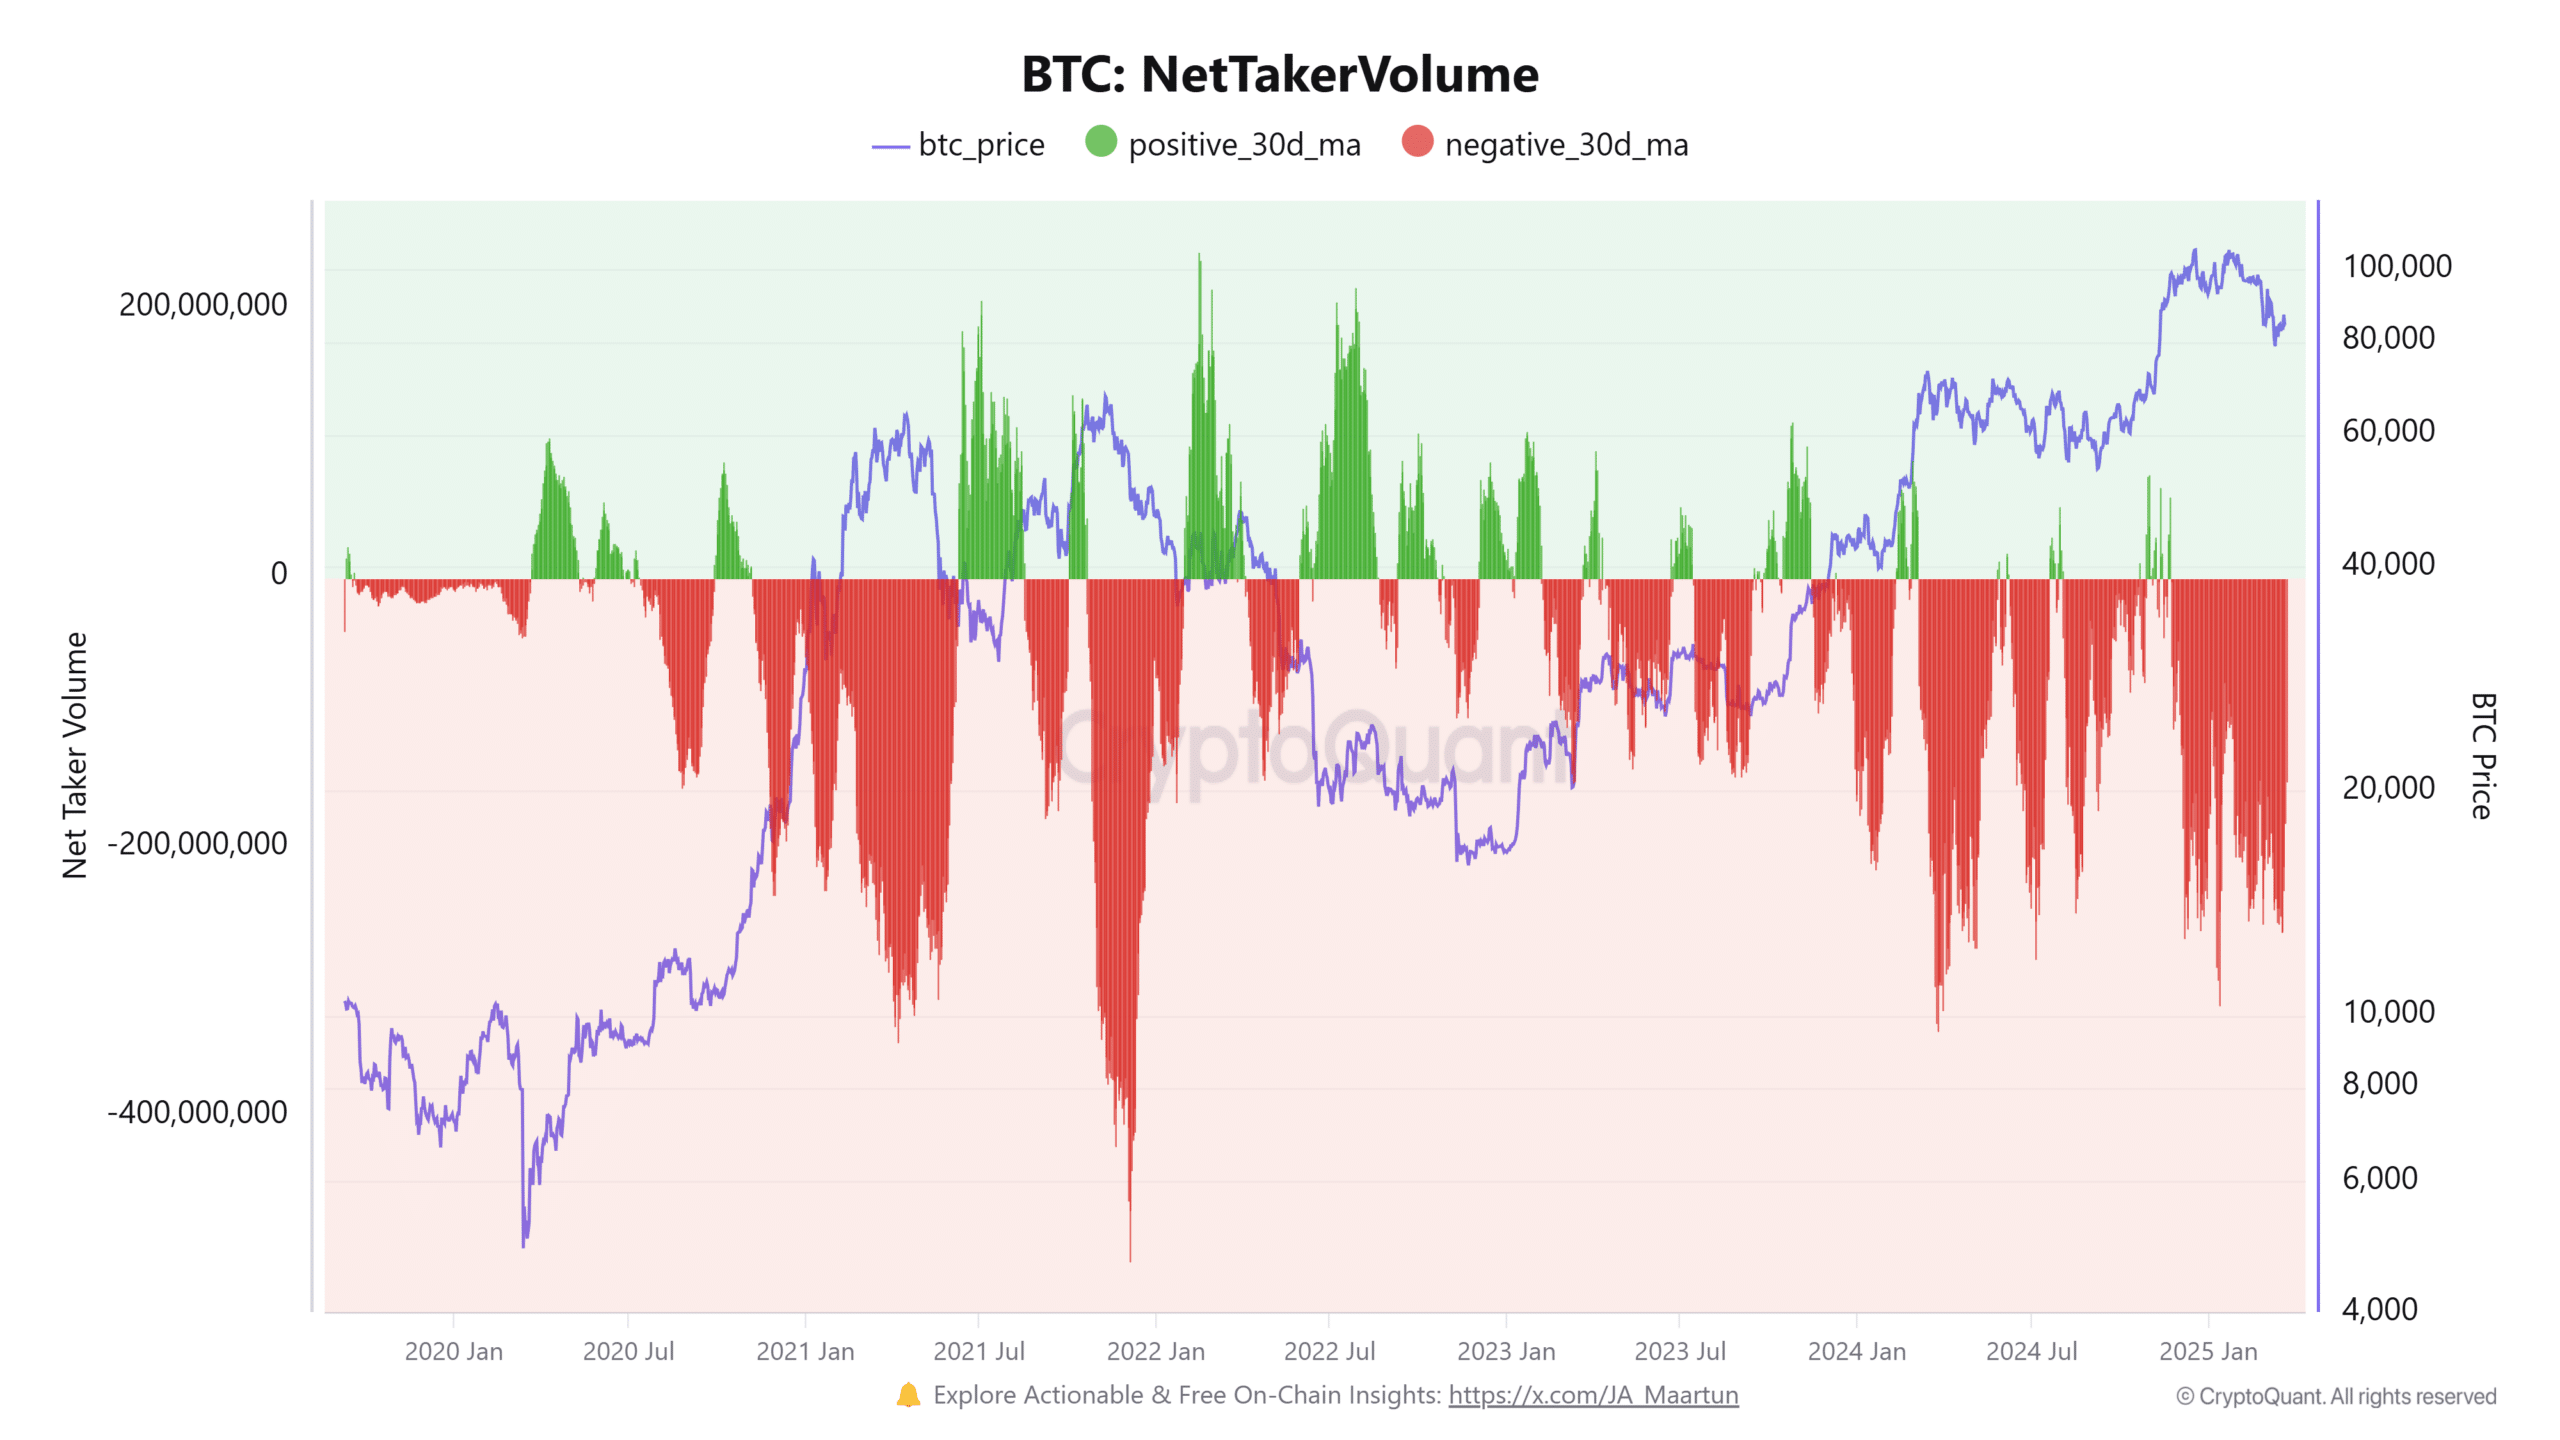
Source: CryptoQuant
Although there have been short bursts of positive net taker volume in recent months, these have yet to establish a consistent green run.
This suggests that while sellers may be backing off in the short term, the market still carries overhang from earlier aggressive selling phases.
A full shift to a sustained green phase on this chart would strengthen the bull case significantly.
BTC price closes above key support
On the price front, Bitcoin broke through the 50-day Moving Average [MA] at $85,017 and was trading at $87,134.
The 12-hour chart also showed improving momentum, with the Relative Strength Index [RSI] rising to 58.35 — nearing bullish territory but not yet overbought.
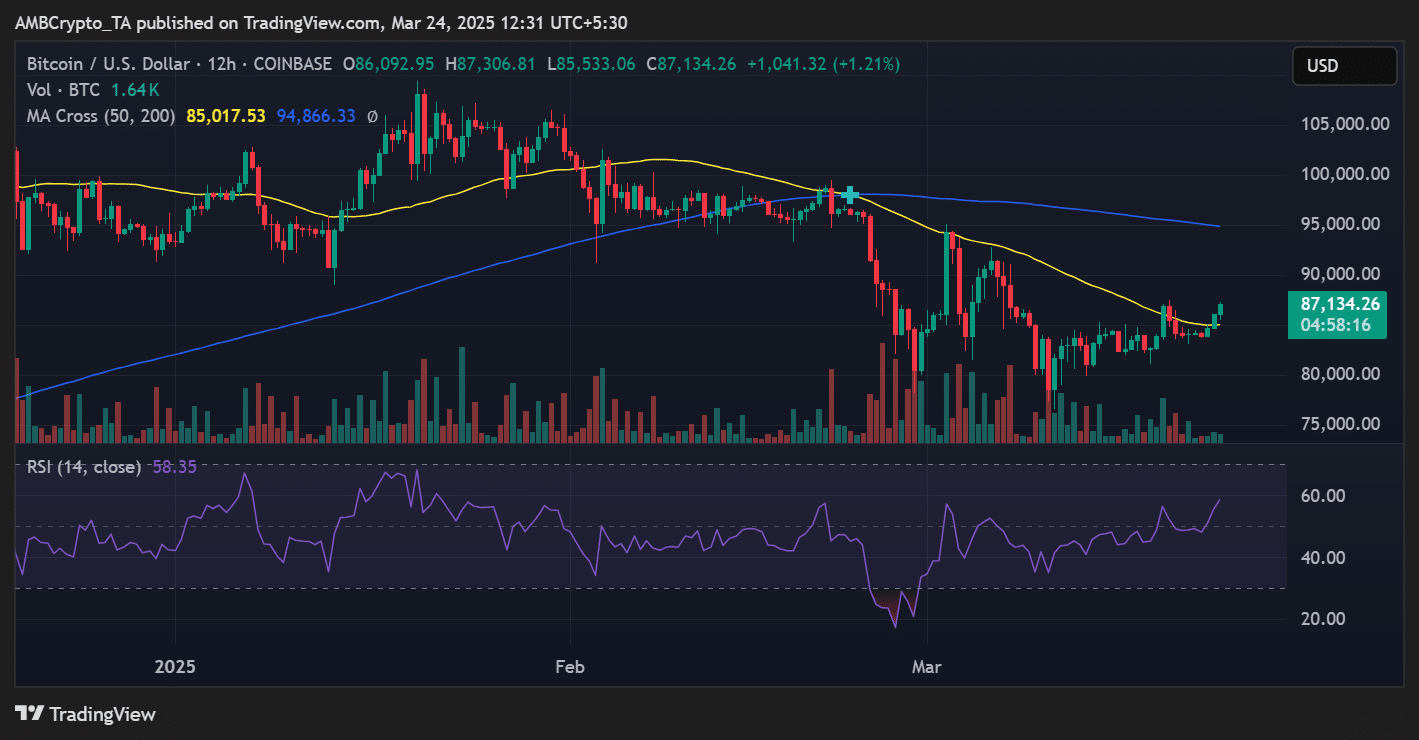
Source: TradingView
Volume remained relatively stable, but if BTC clears the 200-day MA resistance at $94,866, it could open a path to retesting the $95K–$100K region. However, rejection near that band would imply more sideways action.
What to expect this week?
The key variable is whether buyer demand can sustain the momentum without external catalysts. So far, data suggests a decent risk-reward setup for a continued recovery.
Still, cautious optimism is warranted, especially with BTC approaching a psychologically significant resistance zone.
Bulls could push toward higher targets if cumulative net taker volume holds above zero and BTC remains above its 50-day MA.
On the other hand, a drop back below $85K would signal weakness and possibly reintroduce short-term bearish pressure.