
Bitcoin is retreating after nearly hitting a new all-time high price just days ago—so where might it be heading next? If you’re into technical analysis, you’ve come to the right place. Let’s take a look at the charts:
Bitcoin declined 1.2% to $107,369 and Ethereum dropped 0.96% to $2,746 as cooler-than-expected Consumer Price Index data triggered a classic “buy the rumor, sell the news” reaction in crypto markets. The initial surge above $110,000 for Bitcoin and near $2,880 for Ethereum quickly reversed as profit-taking emerged following the CPI report that showed annual inflation at 2.4% versus the 2.5% forecast.
Technical analysis reveals both assets remain within well-defined ascending channels, suggesting the pullback represents normal retracement rather than trend reversal. The Crypto Fear and Greed Index, which gauges investor appetite for these risky assets, declined from 72 to 71, indicating a small cooling sentiment in what had been an increasingly greedy market environment.
Bitcoin holders take profits near all-time high
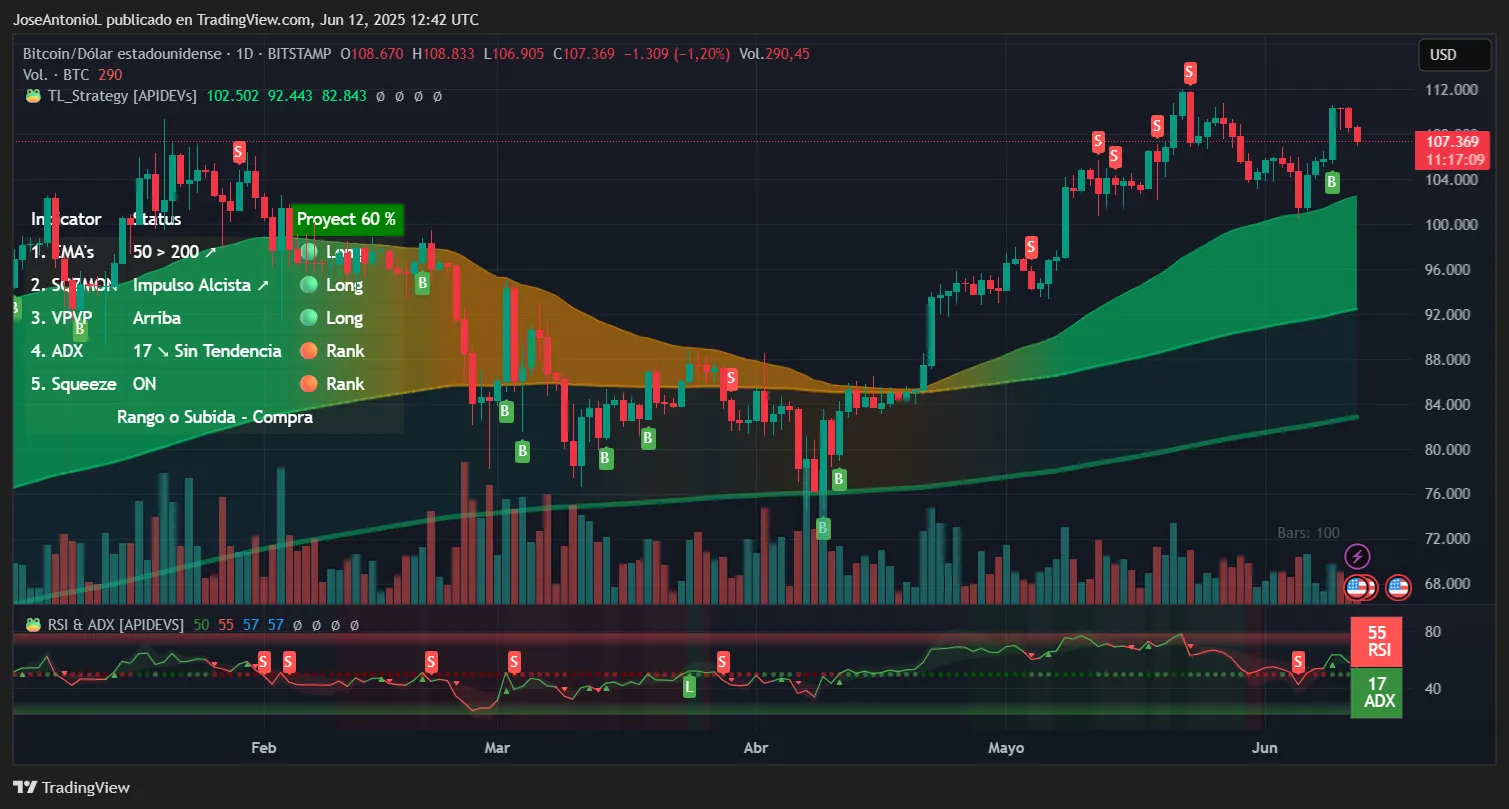
The daily chart reveals Bitcoin is trading comfortably above the EMA50 (the average price of Bitcoin over the last 50 days), in an horizontal channel that started forming in mid-May, consolidating prices after a bullish correction erased losses from February to April. This green uptrend channel is crucial—as long as Bitcoin remains within these boundaries, the broader bullish structure stays intact for traders watching these indicators.
Current technical indicators paint a measured picture. The Relative Strength Index, or RSI, is at a neutral 55 and suggests Bitcoin has cooled off from recent highs without becoming oversold. There’s room for upward movement before hitting overbought territory of 70+ on the scale. The RSI quantifies the speed and magnitude of recent price changes, helping traders understand if an asset’s price movements are strong and sustained, or weak and potentially reversing
The Average Directional Index reading at 17 points indicates that the immediate trend strength is moderate to weak rather than explosive, suggesting we’re in a consolidation phase rather than a strong trending move. This indicator measures how strong a specific price trend is. However, the 50-day EMA trading above the 200-day EMA confirms the longer-term bullish bias remains intact since short term traders are operating at prices above those of people who trade the coin for a longer time.
The key support zone sits at the lower boundary of the ascending channel around $103,000. A break below this level would signal potential weakness, while holding above maintains the path toward the channel’s upper boundary near all-time high prices.
Despite the dip, Ethereum is still bullish—a bit more than Bitcoin
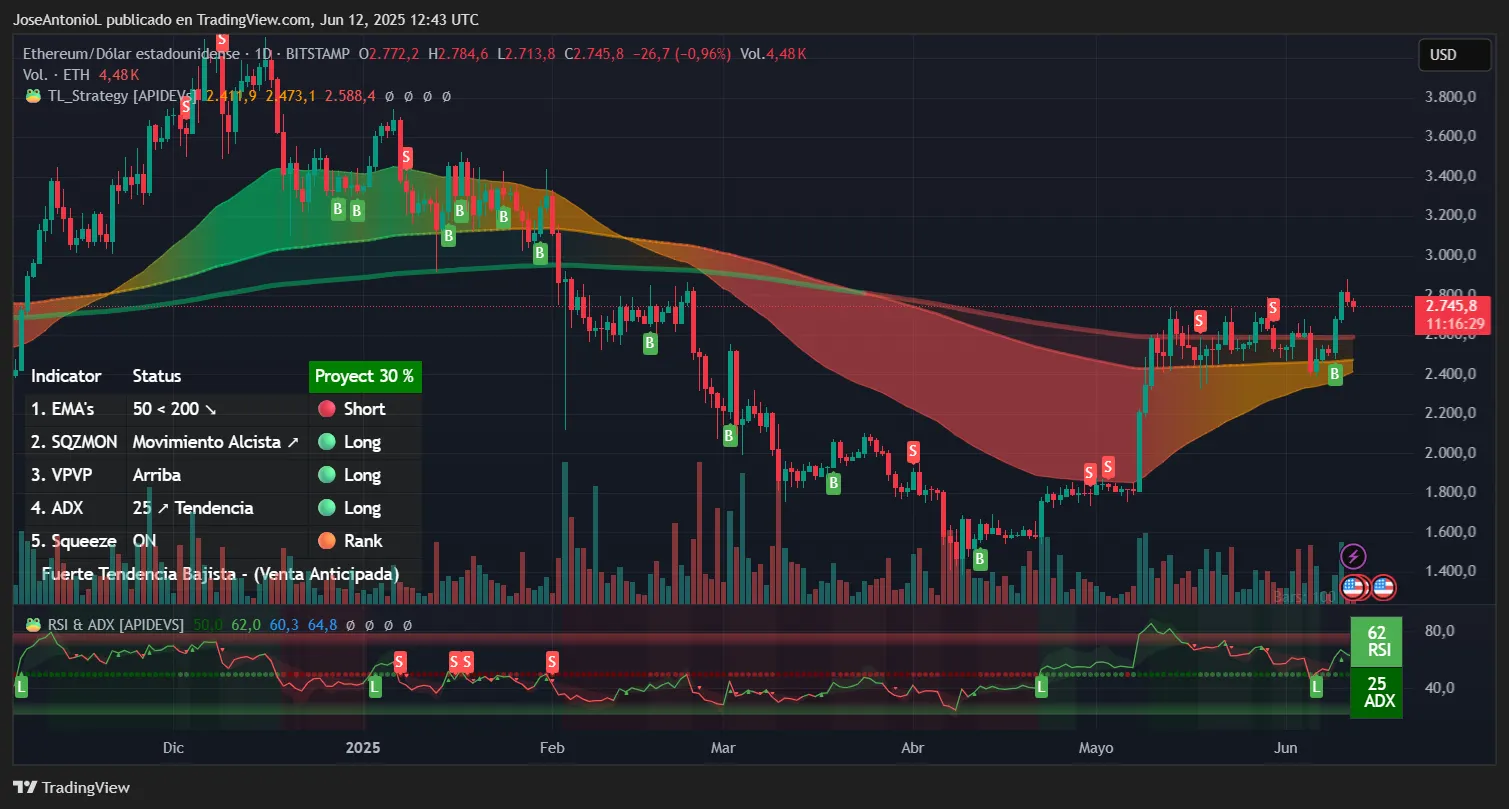
Ethereum’s chart structure is notably more bullish than Bitcoin’s, currently breaking its own horizontal channel that consolidated its price bouncing around $2,400 and $2,700 after major bullish momentum on May 8. The price action shows ETH has successfully defended the channel’s support multiple times, building confidence in the pattern.
Technical momentum indicators show more optimism among ETH traders.
The RSI at 62 indicates Ethereum is approaching but not yet in overbought territory, suggesting potential for further upside before a meaningful pullback.
The ADX at 25 is definitely a less ambiguous reading than Bitcoin’s, indicating a stronger trend momentum in Ethereum’s favor. However, there seems to be a phase of volume compression currently at play.
The $2,400-$2,500 channel support offers a compelling risk/reward setup for those seeking entry points, while a break above $2,850 could trigger momentum toward $3,000 and $3,300.
Next key levels to watch: Bitcoin’s channel support at $104,000-$105,000 and Ethereum’s channel resistance at $2,850. These levels will likely determine whether we see renewed institutional buying or deeper corrections in the near term.
Daily Debrief Newsletter
Start every day with the top news stories right now, plus original features, a podcast, videos and more.