- Bitcoin whale inflows surged by 1,363% in seven days, while outflows dropped 61.63%.
- The NVT Ratio declined 11.48% as the Stock-to-Flow Ratio climbed 33.34%, indicating a bullish divergence.
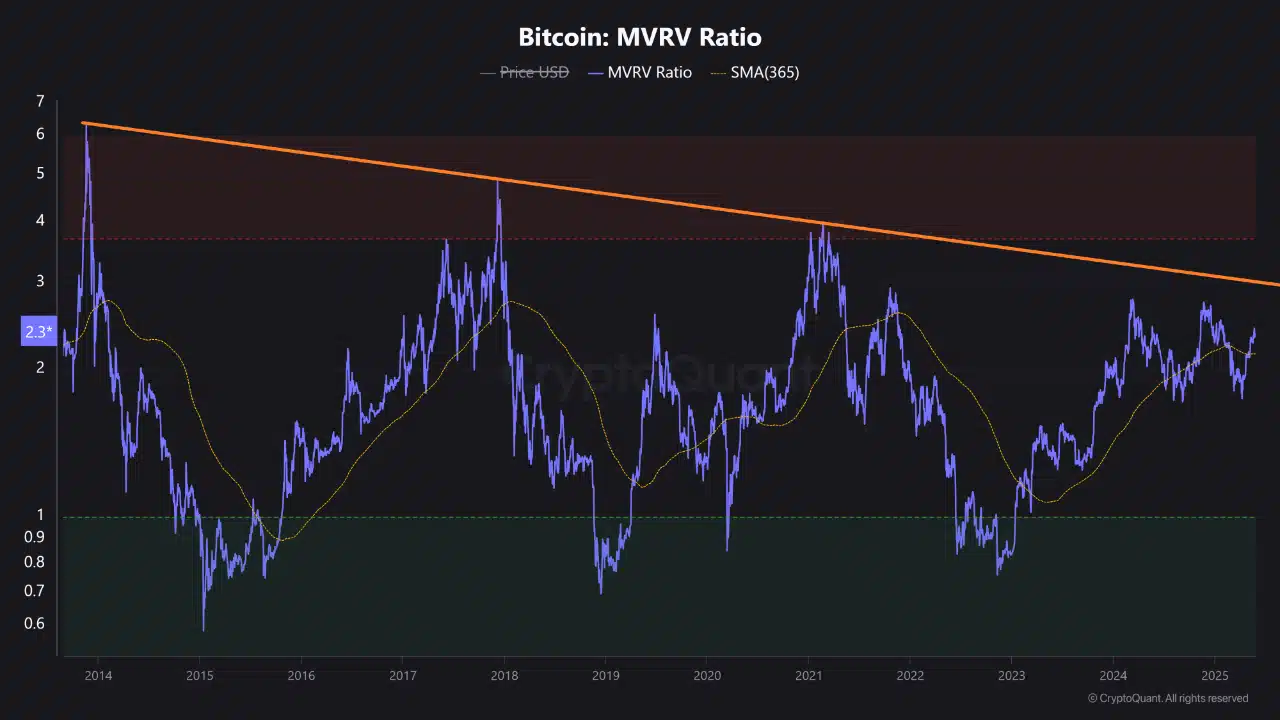
Bitcoin [BTC] has pushed above its 365-day MVRV Moving Average (SMA365), currently at 2.36—a historically pivotal level.
This threshold has often acted as a trigger point for significant upside moves, as seen in late April, when BTC surged from $94K to $111K after a similar breakout.
This shift suggests long-term holders are now in a profitable zone, fueling renewed optimism.
BTC was trading at $108,864 at press time, down just 0.80% on the day. However, staying above the SMA365 could mark the start of a broader bullish phase—if buyers hold the line.
Source: CryptoQuant
BTC NVT ratio drops -11.48%
On-chain valuation metrics painted a complex picture.
The NVT ratio dropped by -11.48% to 31.43, signaling that transaction volume is growing faster than market cap, often a bullish sign of rising utility.
In contrast, the Stock-to-Flow ratio surged by +33.34%, indicating that Bitcoin’s supply is tightening.
This divergence suggests strong demand-side growth coinciding with decreasing supply availability.

Source: CryptoQuant
Whale activity has shifted dramatically in favor of accumulation.
Weekly Large Holder Inflows soared +1,363%, while outflows fell -61.63%. Over 30 days, inflows jumped a massive +4,112%, confirming consistent, non-speculative accumulation.
This imbalance between incoming and outgoing volume implies a deliberate accumulation strategy rather than short-term speculation.

Source: IntoTheBlock
$104K–$107K long cluster and $110K–$113K short risk
Liquidation data from Binance showed a dense cluster of long liquidations between $104K and $107K. Conversely, heavy short liquidations lie just above current price levels, concentrated between $110K and $113K.
With BTC now trading around $108.8K, it finds itself in a pressure zone. Any sharp movement could cascade into forced liquidations on either side.
However, with buyers maintaining momentum, a break above $110K could ignite a wave of short squeezes.
Retail trader sentiment remains bearish despite improving metrics.
CoinGlass data showed 57.46% of traders were short, pushing the Long/Short Ratio to just 0.74. If price breaks higher, this crowding could backfire hard.

Source: CoinGlass
Stochastic RSI dips to 16.03
Technically, BTC remains in an uptrend but is consolidating beneath the key $112K resistance level.
The Stochastic RSI is now deeply oversold, with values at 16.03 and 17.08—typically a precursor to an upward reversal.
Meanwhile, the 9/21 MA crossover continues to support bullish continuation as long as price stays above $106K. However, volume and momentum have slowed, suggesting the market awaits a catalyst.
Therefore, traders should watch for a strong breakout or rejection at $112K, which could define BTC’s short-term direction.

Source: TradingView
Will the breakout hold?
BTC’s breakout above its 365-day MVRV average, along with rising whale inflows and a falling NVT ratio, points to strengthening bullish undercurrents.
However, the presence of dense liquidation zones and bearish retail sentiment introduces significant volatility.
If BTC pushes above $110K with volume, short liquidations could fuel a breakout toward $113K–$115K.
Otherwise, a rejection near current levels might trigger a retest of $104K–$107K. For now, metrics suggest the bias favors the upside—but momentum must confirm it.