
- Bitcoin’s Value Days Destroyed metric has dropped to its lowest level since mid-2024, signaling a shift to accumulation.
- Historical patterns showed that low VDD phases often precede bullish price movements, strengthening the long-term outlook.
Bitcoin [BTC] may be amid another strategic buildup as seasoned market participants shift gears from profit-taking to accumulation.
This evolving trend is evident in the latest on-chain data, particularly the Value Days Destroyed (VDD) metric, which has now reached a phase historically associated with future price surges.
Bitcoin long-term holders re-emerge as accumulators
The Bitcoin VDD chart reveals four significant accumulation phases: January and October 2023, October 2024, and now March 2025.
Each phase is marked by a sharp drop in VDD, signaling reduced coin movement and increased conviction among long-term holders. The current reading, highlighted by the fourth blue circle on the chart, is the lowest since mid-2024.
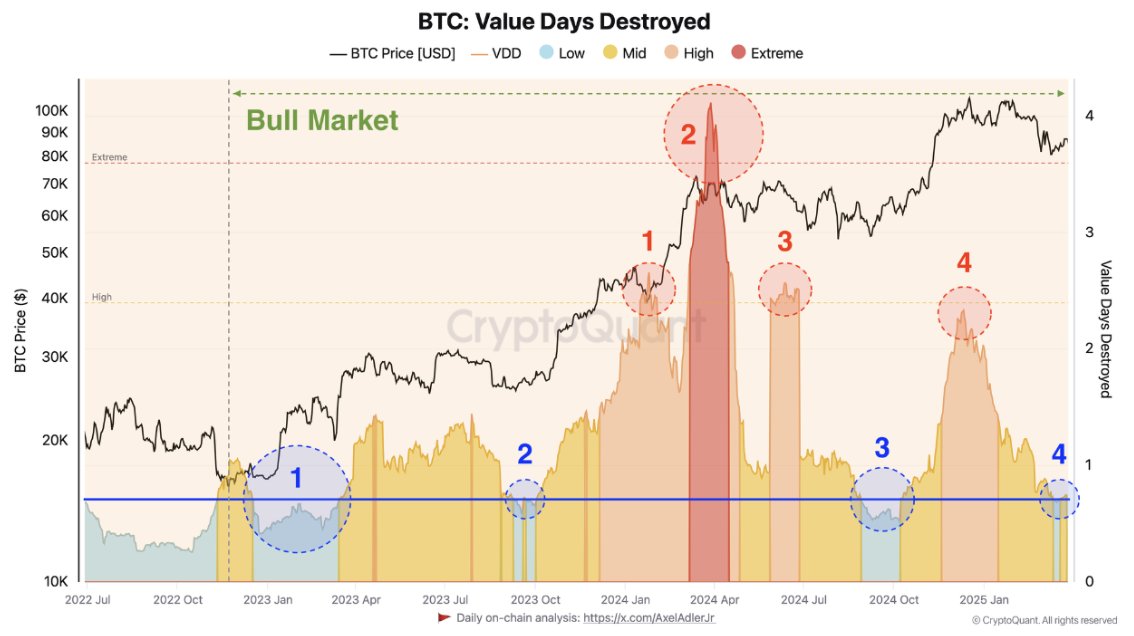
Historically, such low VDD values have preceded strong bullish moves. In each previous accumulation phase, Bitcoin registered a new leg up shortly after.
The behavior of these seasoned participants, buying low and exiting near local tops, offers a reliable gauge for broader market sentiment. Their current stance suggests they do not see present price levels as opportune for distribution.
No signs of profit-taking from smart money
Red circles on the Bitcoin VDD chart point to four distinct selling spikes—January, April, July, and March 2025.
Each surge in value destruction corresponded to local tops, underscoring how strategic these entities are in capturing profits. But as of now, there’s no such spike.
The absence of realized value destruction supports the theory that smart money is staying put. Their conviction adds credence to a price floor forming near the $82K level, discouraging aggressive short-selling in the current structure.
Bitcoin price action aligns with on-chain calm
Bitcoin traded at $82,011 at press time, below both the 50-day and 200-day Moving Averages at $84,455 and $93,712, respectively.
Despite the bearish short-term structure, the Accumulation/Distribution Line is stable at 4.93M, indicating that distribution pressure hasn’t intensified.
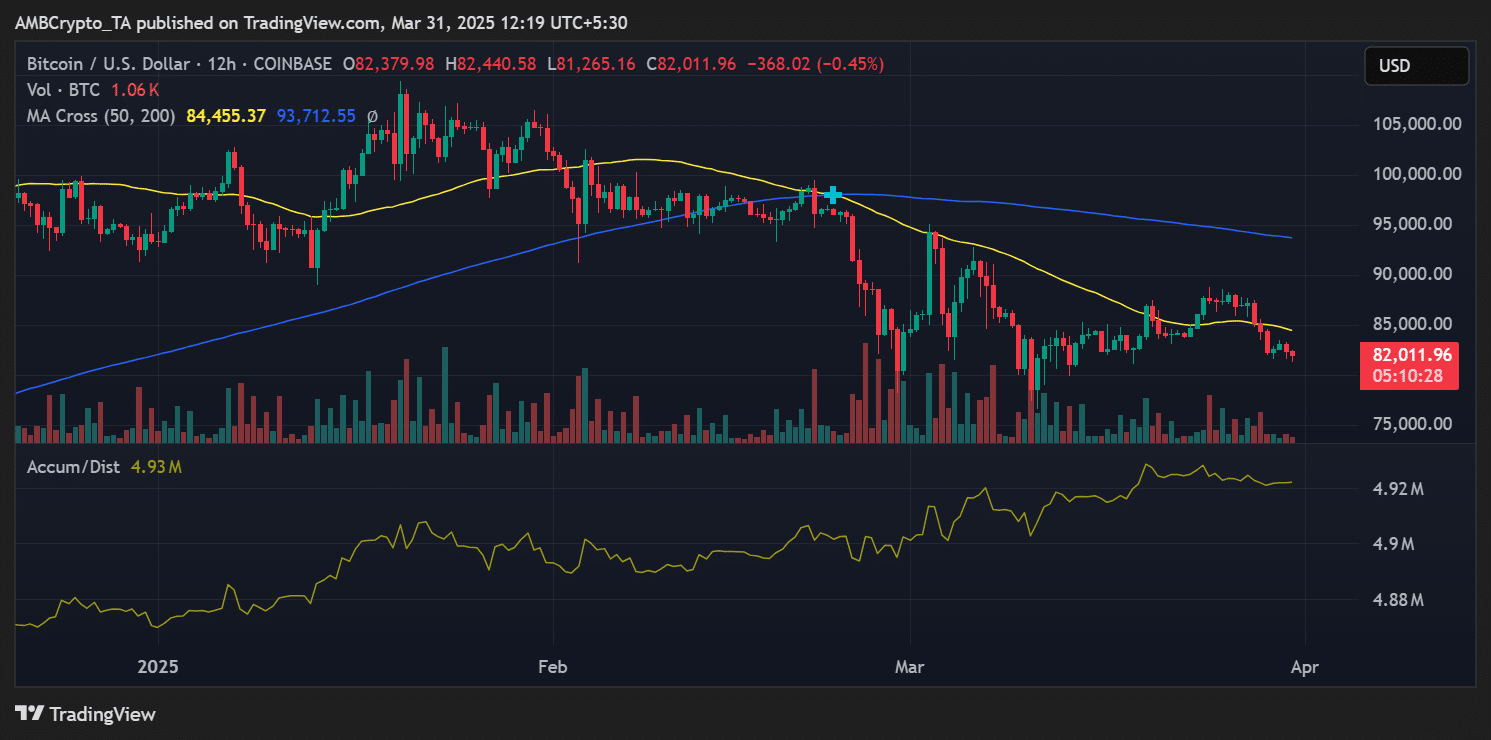
Source: TradingView
This divergence, price weakness vs. steady A/D levels, could point to a hidden bullish divergence forming. It could confirm this thesis if the price stabilizes and breaks above the $ 84K-$ 85K resistance zone.
What next?
Bitcoin’s low VDD environment, combined with the accumulation behavior of long-term holders and muted distribution metrics, signals a potential bottoming phase.
If historical patterns repeat, BTC may be setting up for its next bullish impulse.