
![]()
![]()
Journalist
Posted:
- The H4 swing structure of Bitcoin was bearish
- A move below the local support level could be followed by a rebound toward $99k
Bitcoin [BTC] saw reduced trading volume and volatility over the past ten days following the retest of $92k in early February. This lack of momentum and trend can confound swing traders.
Technical analysis showed that a strong move might not materialize this week, but it does present some trading opportunities.
As things stand, the price action and the liquidation heatmap indicated a move to $94k could be unfurling.
Bitcoin has defended the $95.5k support, but…
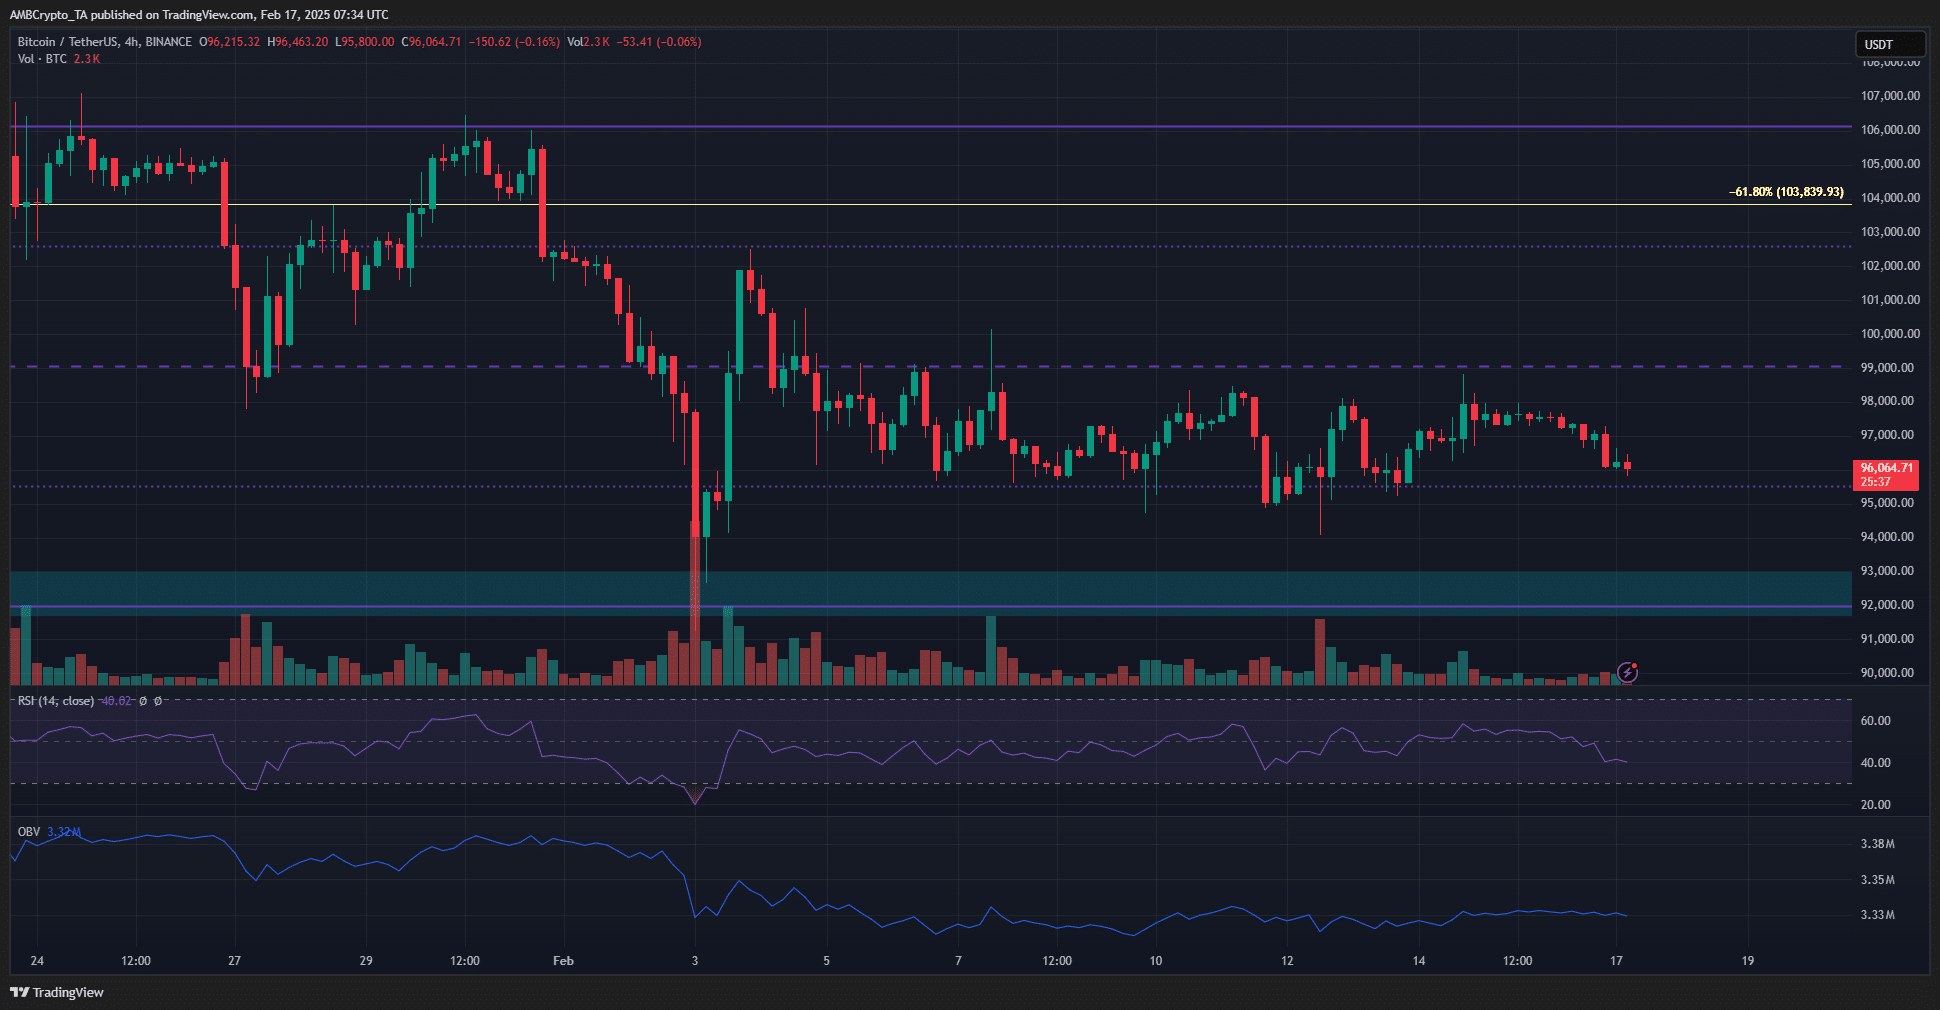
Source: BTC/USDT on TradingView
At press time, Bitcoin was headed to the 0.25 level within its range. The 25% and 75% levels within the range generally serve as support or resistance, but aren’t as strong as the mid-range level.
The 4-hour RSI has dropped below neutral 50, indicating a shift in momentum. The swing market structure on this timeframe is bearish, with the $98k-$99k zone being a stern resistance over the past two weeks.
The low trading volume over the past few days means the OBV has barely moved recently. The recent downward price movement was also supported by weak volume, suggesting it might halt at $95k-$95.5k.

Source: Coinglass
The 1-week liquidation heatmap highlighted the $94k area as a strong magnetic zone. To the north, the local highs at $99k was also a liquidity pocket of note.
The short-term bearish momentum could take the BTC price to $94k before rebounding to the next magnetic zone at $99k.

Source: Coinglass
The 24-hour chart supported this idea too. The price is more likely to visit the $95.2k level, which is the closest area of significant liquidation levels, rather than the $97.8k level.
This minor dip lower could pave the way for a move to $94k and a rebound, and would be the expectation for Bitcoin’s price movement this week.
Disclaimer: The information presented does not constitute financial, investment, trading, or other types of advice and is solely the writer’s opinion