
In brief
- Over $500 million in long positions in the crypto market were liquidated in the past 24 hours.
- Bitcoin and XRP prices are holding to support levels, but there are caution flags being waved.
- Ethereum, meanwhile, continues to show strength despite the dip.
The crypto market is painting the charts red today, with a sweeping correction hitting pretty much every major asset as traders take profits.
Bitcoin dropped 2% to test the $115K mark, XRP slipped below that battle-tested $3 price point, and Ethereum dipped 3.5% to under $4,400. The selloff reflects a classic cocktail of profit-taking, leverage unwinding, and mounting macro uncertainty ahead of Federal Reserve Chair Jerome Powell’s critical Jackson Hole speech this week.
The market carnage has been particularly brutal for leveraged traders. Bitcoin alone saw over $120 million in liquidations in the past 24 hours driven by excessive leverage. XRP longs got rekt to the tune of $20 million, and Ethereum long positions got hosed for over $190 million.
All in all, the crypto market as whole experienced over $500 million in forced selling with long positions getting crushed at a 5:1 ratio to shorts, according to data from CoinGlass.
This liquidation cascade comes after Bitcoin’s remarkable run to $124,500 last week, suggesting overheated positioning needed a reset.
What do the charts say happens next? Let’s dive in:
Bitcoin (BTC) price: Testing critical support
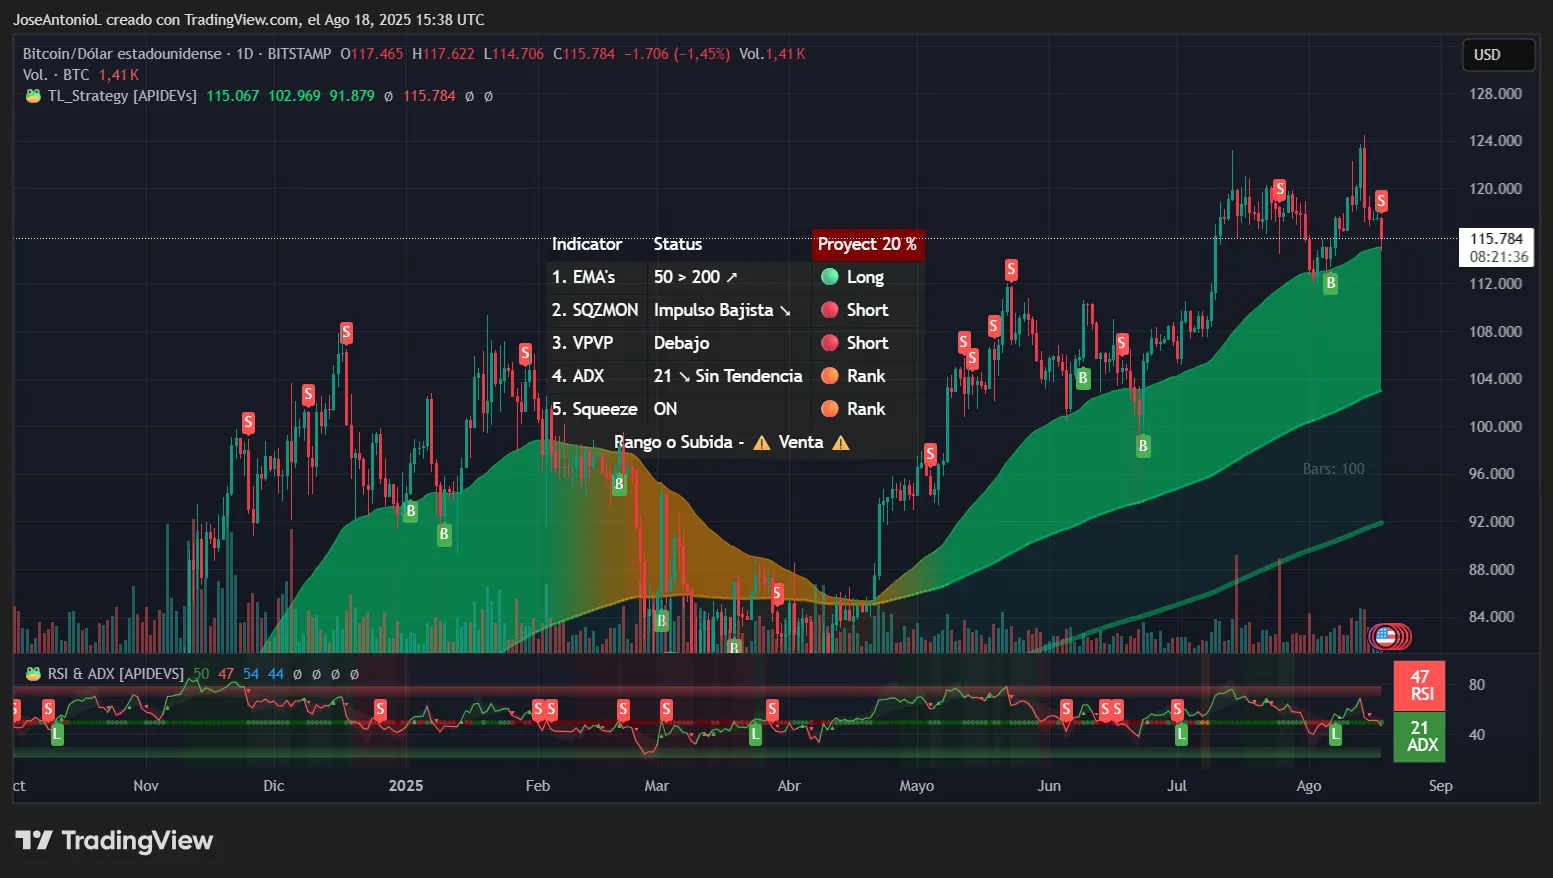
Bitcoin opened today at $117,465 before sliding to a low of $114,706 then bouncing to its current price just above $116,000. The flagship cryptocurrency’s relatively modest drop compared to altcoins suggests institutional support remains. But technical indicators are starting to look not so cute if you’re a Bitcoin permabull.
You wouldn’t know it, though, by gauging general sentiment, including on Myriad—a prediction market created by Decrypt’s parent company Dastan. At the moment, Myriad traders still give Bitcoin a 60% chance to hit a new all-time of $125,000 before dipping back down to $105K. But the optimism is waning: Just days ago, the odds were at 90% on this market on Myriad.
That makes sense, given what the charts are showing: a major cooldown with bears retaking some ground.
Bitcoin’s Relative Strength Index, or RSI, is at 47, sitting almost perfectly in neutral territory—neither oversold nor overbought. RSI is like a thermometer for the market, measuring how hot or cold things are on a scale from 0 to 100. Right around 50 suggests the market is in equilibrium.
For traders, this means Bitcoin isn’t stretched in either direction, suggesting room for movement both up and down. This neutral reading after a decline often precedes consolidation before the next directional move. This often makes it easier for day traders to determine zones of support and resistance, then open positions and play with the bounces before a decisive move in either direction.
Right now, traders would likely point to the $116K-$120K zone as a good reference point to set stop loss and take profit orders in leverage markets.
Bitcoin’s Average Directional Index, or ADX, is at 21, which tells an important story about trend strength. ADX measures how strong a price trend is on a scale from 0 to 100, where readings below 25 indicate no clear trend. At 21, Bitcoin is in a “trendless” state, which usually means choppy, range-bound trading to come.
Traders interpret this as a market searching for direction—not ideal for trend-following strategies but potentially profitable for range traders who buy support and sell resistance. This further validates the idea of traders potentially playing with the price bounces in short timeframes until markets decide whether BTC moons or dips.
But if you’re looking for bullish signals, then look no further than the exponential moving averages for BTC. These averages, or EMAs, give traders a better idea of where price supports may be by taking the average price of an asset over a set period of time.
At the moment, Bitcoin’s 50-day EMA, the shorter average, is above the 200-day EMA, the longer average. This typically signals longer-term bullish momentum. However, with price action now testing these averages, they’ll act as dynamic support levels.
The Squeeze Momentum Indicator showing “on” status is particularly significant. This indicator identifies when volatility compresses before explosive moves, suggesting a big move is brewing but prices are failing to gather enough strength to break either the buy or sell walls.
Key Levels:
- Immediate support: $114,700 (today’s low)
- Strong support: $110,000 (psychological level)
- Immediate resistance: $120,000 (horizontal channel resistance)
- Strong resistance: $124,500 (all-time high)
Ethereum (ETH) price: Strong trend despite correction
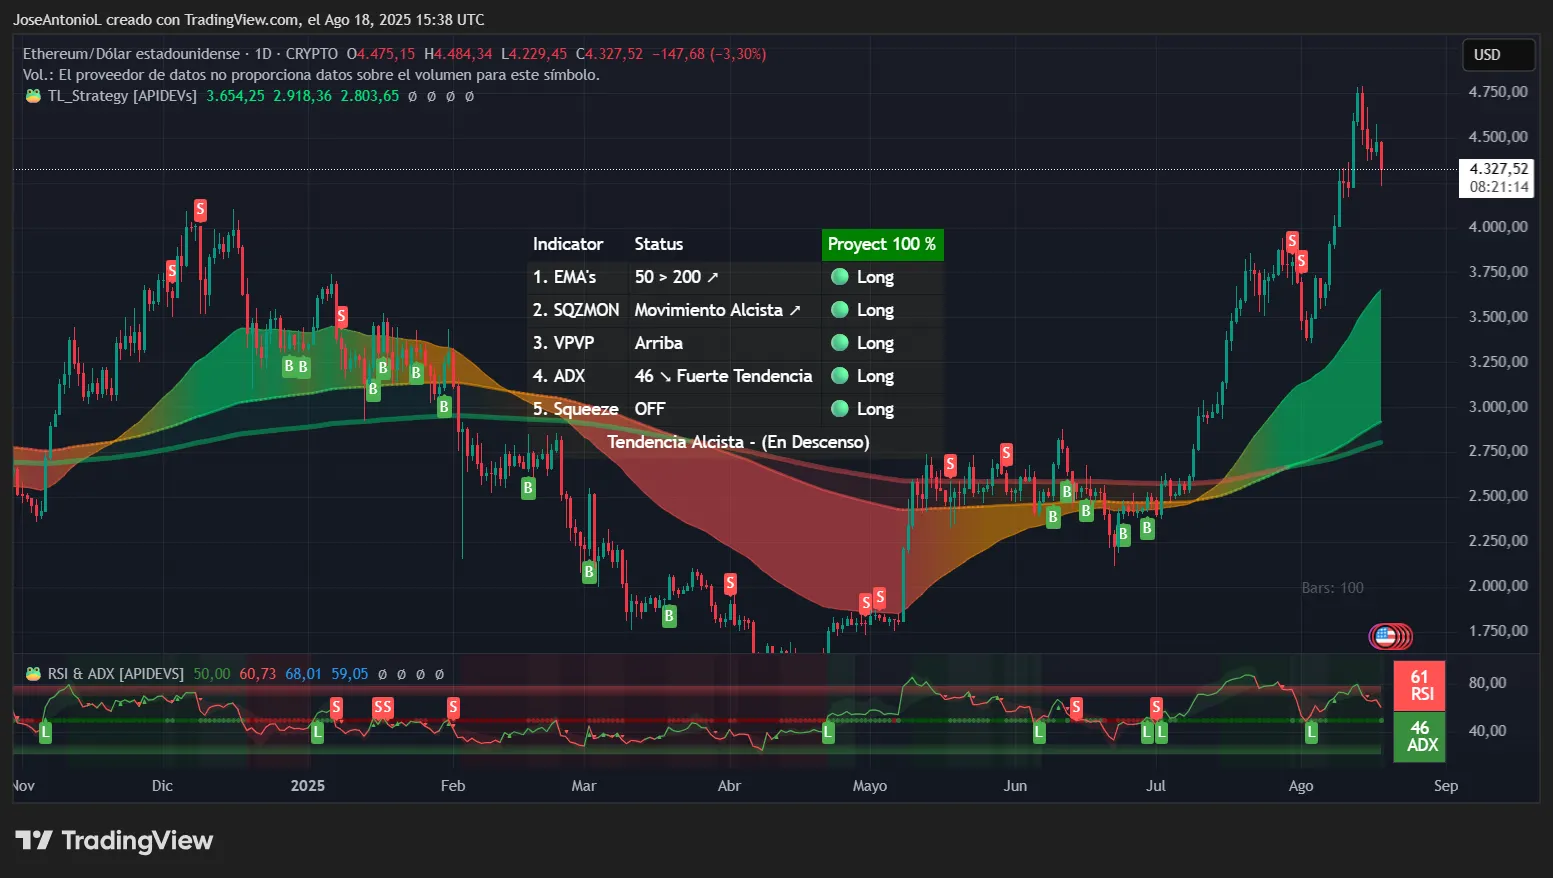
While Bitcoin’s dip may have been modest, Ethereum’s drop was notably harsh. ETH opened at $4,475.15 and tumbled to a low of $4,279.45 before settling at $4,327.52, a painful 3.30% decline.
And yet, despite the selloff, ETH’s technical structure on the charts remains surprisingly robust.
What’s more, the correction hasn’t dampened the mood among traders on prediction markets—at least, not entirely. Myriad users still expect to see a new Ethereum ATH by the end of 2025. But those odds have sunk relative to last week’s high, dropping from 93% to just 77% today. In other words, Myriad predictors remain bullish, but not nearly with the same conviction.
Again, this tracks with what the ETH charts are showing.
Ethereum’s RSI is at 61, which is a welcome sight for ETH bulls after a 3% drop in price. RSI above 50 typically indicates buying pressure outweighs selling, and readings between 60-70 suggest strong momentum without being overbought. This tells traders that despite today’s decline, the underlying buying interest remains intact. It’s like a strong athlete taking a breather—tired but not exhausted.
The ADX at 46 is exceptionally strong and deserves attention. When ADX reads above 40, it indicates an extremely powerful trend. This is “trending strongly” territory where momentum traders thrive. Despite today’s pullback, this high ADX suggests the broader uptrend remains intact. It would be very easy for traders to interpret this data as a healthy correction within a bull market rather than a reversal.
The 50-day EMA sitting well above the 200-day EMA creates another bullish buffer zone. This wide gap acts as multiple layers of support during corrections. Currently, ETH would need to fall significantly further to threaten this bullish structure. The Squeeze Momentum showing “off” status indicates the recent volatility expansion has played out, suggesting a period of consolidation ahead.
Key Levels:
- Immediate support: $4,163 (weak support)
- Strong support: $3,800 (break below the psychological $4,000 level and previously tested area)
- Immediate resistance: $4,775 (all-time high)
- Strong resistance: $5,000 (psychological round level after price discovery)
XRP price: Bears take control
Meanwhile, XRP holders continue to be taken on a wild ride.
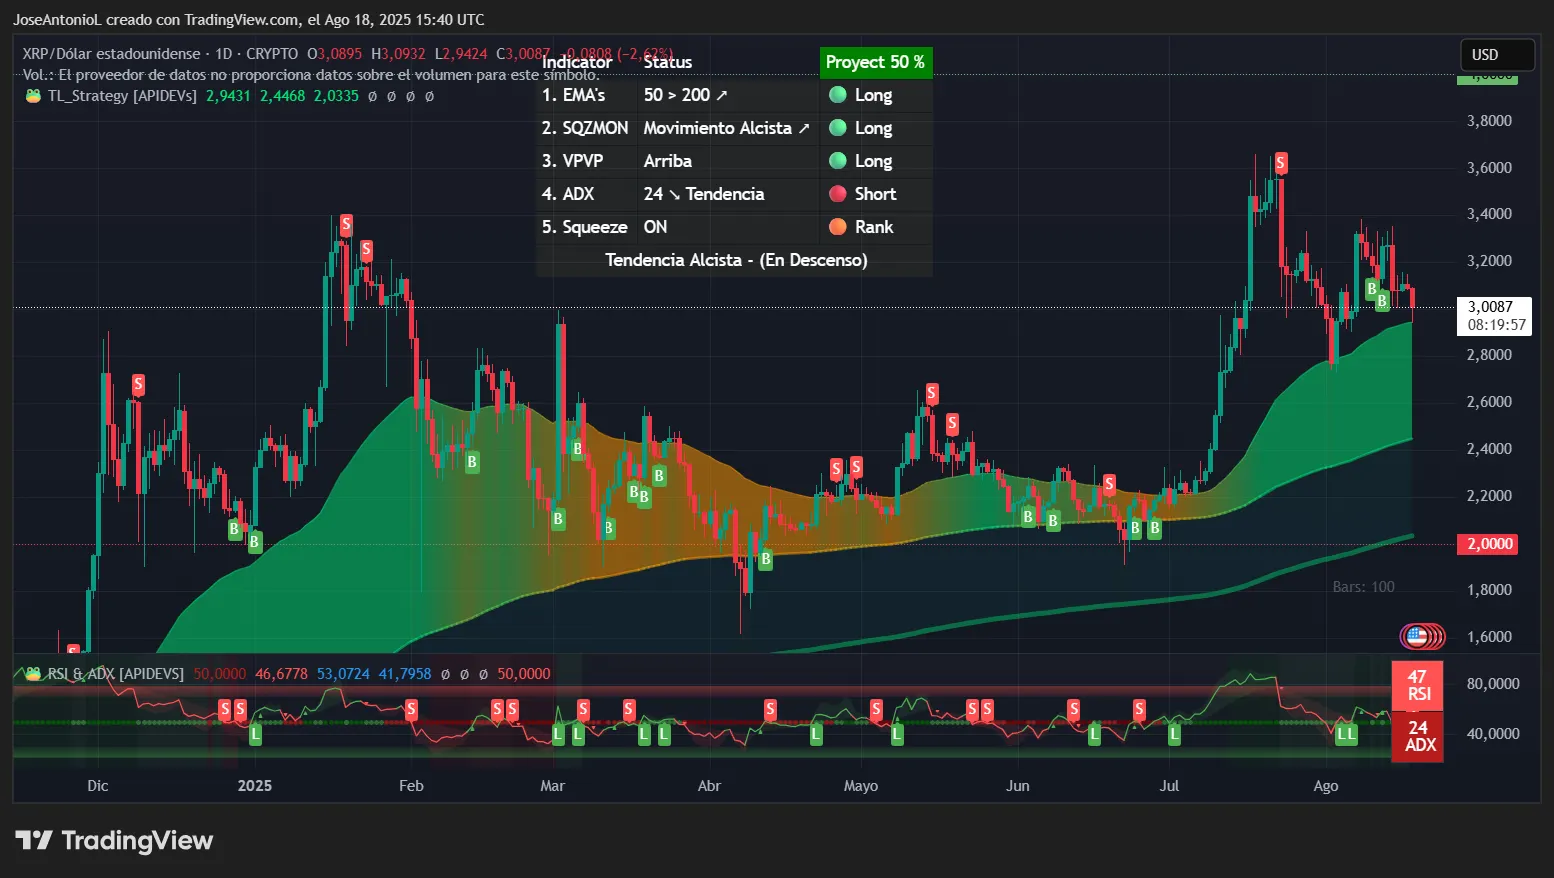
The Ripple-linked token started the day at $3.0895 before bears drove it down to $2.9424, breaking below the psychological significant price point of $3.00. At the moment, it’s trading slightly above that mark. But the token’s inability to hold above the $3 level, or go higher, signals short-term weakness.
Prediction market traders are also expressing caution after the recent run-up and subsequent dip for XRP. On Myriad, expectations are split almost evenly between those who think the coin will maintain its bullish momentum and touch $4 before a dip and those who expect a stronger correction to come. Myriad users currently place the odds at 56% for the XRP “moon” scenario, but that’s also down significantly from last week, when predictors placed those odds at 75%.
The charts, once again, support this weakened bullish sentiment.
XRP’s RSI is at 47, which places the token in slightly bearish territory—below the neutral 50 line but not yet oversold. This reading suggests mild selling pressure without panic. For traders, RSI between 40-50 often represents a “decision zone” where the asset could either bounce from mild oversold conditions or continue lower if selling intensifies. It’s essentially a coin flip without other confirming signals.
The ADX at 24 is just below the crucial 25 threshold that confirms trend establishment. This “almost trending” reading creates uncertainty. The market is building directional momentum but hasn’t quite committed. Traders often wait for ADX to decisively break above 25 before taking trend-following positions, making current levels a watch-and-wait scenario.
Like with ETH, the EMAs should lift the spirits of the XRP bulls—but only so much.
With the 50-day EMA above the 200-day EMA, the longer-term structure remains bullish. But XRP’s current price proximity to these averages makes them critical battlegrounds. The Squeeze Momentum indicator’s “on” status adds intrigue: This compression indicator suggests volatility is coiling like a spring, ready to release in either direction.
That likely signals caution for traders, since the token has already experienced an explosive upward price move not too long ago. It wouldn’t be so crazy, then, to prepare for a dip now that things are headed in the other direction.
Key Levels:
- Immediate support: $2.94 (today’s low)
- Strong support: $2.80 (psychological level)
- Immediate resistance: $3.09 (opening level)
- Strong resistance: $3.40 (recent resistance zone)
Disclaimer
The views and opinions expressed by the author are for informational purposes only and do not constitute financial, investment, or other advice.
Daily Debrief Newsletter
Start every day with the top news stories right now, plus original features, a podcast, videos and more.