
- Technical patterns show that BONK could see a sharp decline as it finds a rebound level.
- Long liquidations in the market have surged as traders push the price lower.
BONK has been on a declining streak for the past month, which intensified in the past seven days as the asset dropped 10.45%. This decline has continued in the past 24 hours, with the price losing another 2.03%.
Per AMBCrypto’s examination, a much steeper fall is likely as market participants search for the best price to re-enter, potentially pushing the price higher afterward.
A technical path on a declining trajectory
On the chart, BONK is trading within a descending channel characterized by lower highs and lower lows, with price trends moving within a support and resistance zone.
BONK recently reacted off the pattern’s resistance line and has continued to decline, a move that’s likely to extend further downward to the support level, potentially leading to a 27.20% loss.

Source: TradingView
The motive behind this fall is that investors are likely pushing the price lower in search of a discounted level where they can accumulate the asset.
This could drive the price to the support level, and strong momentum may eventually push it higher.
Will the fall happen?
BONK has a high probability of dropping further, as market sentiment in the derivatives market has been strongly bearish.
One key indicator of this is the liquidation data, which shows how much long and short traders have lost within a specific period.
Currently, there have been $438,000 in long liquidations, compared to just $6,400 in short liquidations. This means that for every $1 worth of long contracts liquidated, only $0.0146 worth of short contracts were closed.
The major disparity shows the market is heavily skewed in favor of shorts, suggesting that prices will continue to decline.
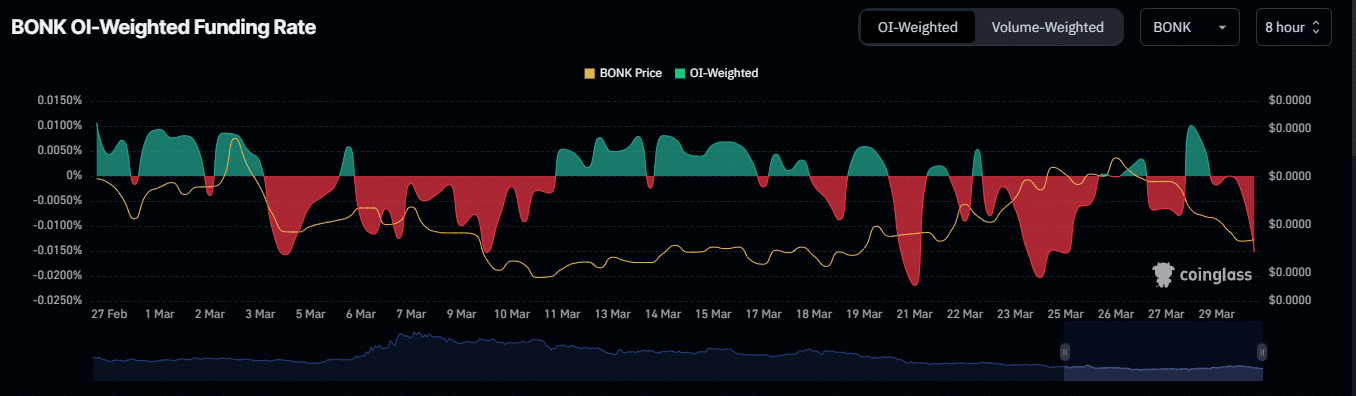
Source: Coinglass
The OI-Weighted Funding Rate, which aggregates Funding Rate and Open Interest data across multiple exchanges, indicates that a massive selling wave is still in play.
At the time of writing, this metric has crossed into negative territory, with a reading of -0.0152. This region is associated with price declines, making it likely that BONK will see a significant drop.
More bearish signals surfaces
The bearish trend in the market remains strong, as two technical indicators—the Parabolic SAR (Stop and Reverse) and Bull Bear Power—confirm the presence of sellers.
The Parabolic SAR, which uses dots to determine potential market direction, indicates downward pressure when dots appear above the price. This suggests BONK could decline further.

Source: Coinglass
Similarly, the Bull Bear Power, which shows whether buyers or sellers are leading market transactions, confirms that sellers (bears) are in control.
The red momentum continues to build, signaling further downward movement. For now, the bears are steering the market, and if this sentiment persists, BONK is likely to trend lower.