- Altcoin’s TD Sequential indicator flashed a buy signal on BONK’s daily chart
- Price charts highlighted the formation of a clear triangle pattern, indicative of a consolidation phase
The cryptocurrency market offers both risks and opportunities for traders. BONK, for instance, has been registering signs of a potential price rebound on the charts lately. In fact, its TD Sequential indicator flashed a buy signal – A sign that a price rebound could be on the horizon.
Breaking through the triangle
According to AMBCrypto’s analysis, a clear triangle pattern seemed to be forming on the charts – Indicative of a consolidation phase before a breakout. In this phase, the price of BONK has been oscillating between a descending upper resistance and an ascending lower support, with the two lines converging towards the breakout point.
Usually, such patterns often hint at reduced volatility and greater potential for significant movement once the price breaks through either of these converging lines.
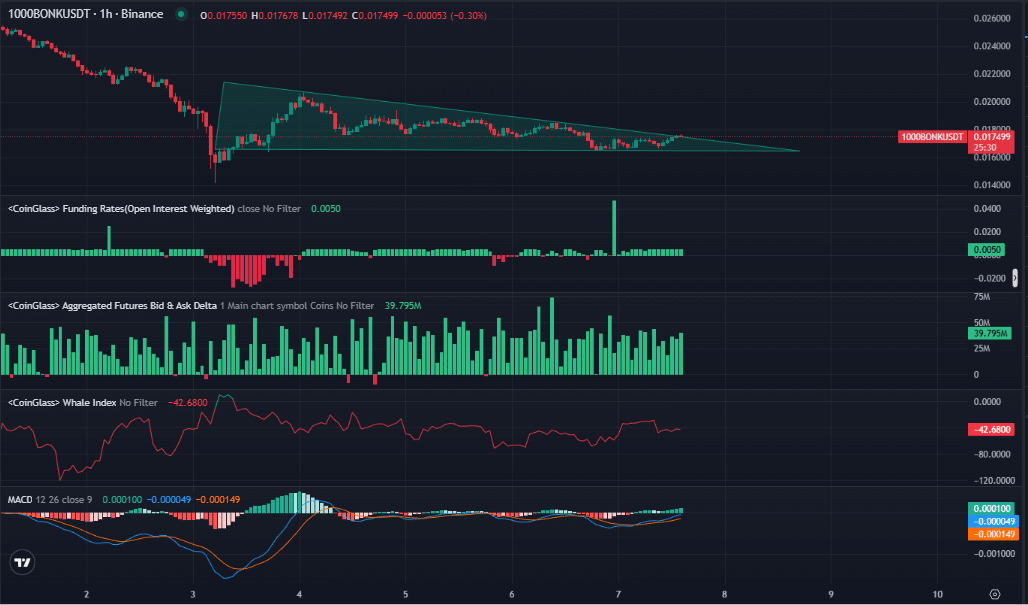
Source: CoinGlass
The recent crossover seen in the MACD indicator, with the MACD line crossing above the Signal line, also seemed to support the possibility of a bullish trend.
This crossover, combined with the consolidation triangle, suggested that momentum could be shifting in favor of the bulls – Reinforcing expectations of positive price movement on the charts.
A sign of change – Is BONK ready for a trend shift?
According to Ali on X, the TD Sequential indicator signaled “buy” on BONK’s daily chart. The TD Sequential is renowned for identifying exhaustion points in price trends, signaling potential reversals.

Source: Ali Charts
What this means is that the latest downtrend in BONK might be nearing its end, with the buy signal indicating that positive momentum may be around the corner soon.
This indicator also suggested that the price could soon reverse its current course, aligning with expectations of a price rebound as market sentiment moves towards buying pressure.
Riding the wave
At the time of writing, BONK’s funding rates registered a figure of 0.0050 – A sign that long positions have been paying short positions. This seemed to allude to a generally bullish market sentiment, one where traders are willing to pay to keep their long positions open.
A positive funding rate reinforces the idea of increasing buying interest. In this particular case, it could potentially contribute to a hike in BONK’s price.
Additionally, the Aggregated Futures Bid & Ask Delta revealed a significant spike in buying interest, with a value of 39.795M. This high delta hinted at strong demand for BONK at its press time price levels. This also implied that the market could adjust in favor of upward movement, pushing the price north as buying pressure intensifies.
What’s behind the market’s big moves?
The Whale Index, with a press time value of -42.6800, indicated that large holders or “whales” are either selling or reducing their positions. While this may seem bearish at first glance, it’s important to consider this in the broader context of other indicators.
The negative Whale Index could reflect profit-taking ahead of a potential rally. Alternatively, once BONK begins to rebound, whales may start accumulating again, further boosting the price.
Therefore, this negative index could turn positive as the market shifts, reinforcing the potential for a price hike.
To put it simply, an analysis of these indicators painted a promising picture for BONK.