- Cardano’s open interest surpasses $1.2B, indicating strong trader positioning for a potential breakout.
- RSI and MACD hint at bullish momentum, with ADA needing to clear $1.00-$1.10 for a rally toward $1.50.
Cardano[ADA] has been gaining momentum, prompting speculation on whether the asset is preparing for a parabolic surge.
With growing Open Interest (OI), increased trading volume, and key technical indicators aligning, ADA could be setting up for a breakout. But how high could it go?
Cardano’s Open Interest and market sentiment
The Cardano OI chart highlights a significant increase, rising alongside price action. OI recently surged past $1.5 billion, signaling heightened speculation and fresh capital entering the market.
Historically, such increases suggest that traders are positioning for a major move, often leading to breakouts or sharp corrections.
However, the open interest has dropped below $1 billion in the last few days.
ADA resistance and support levels
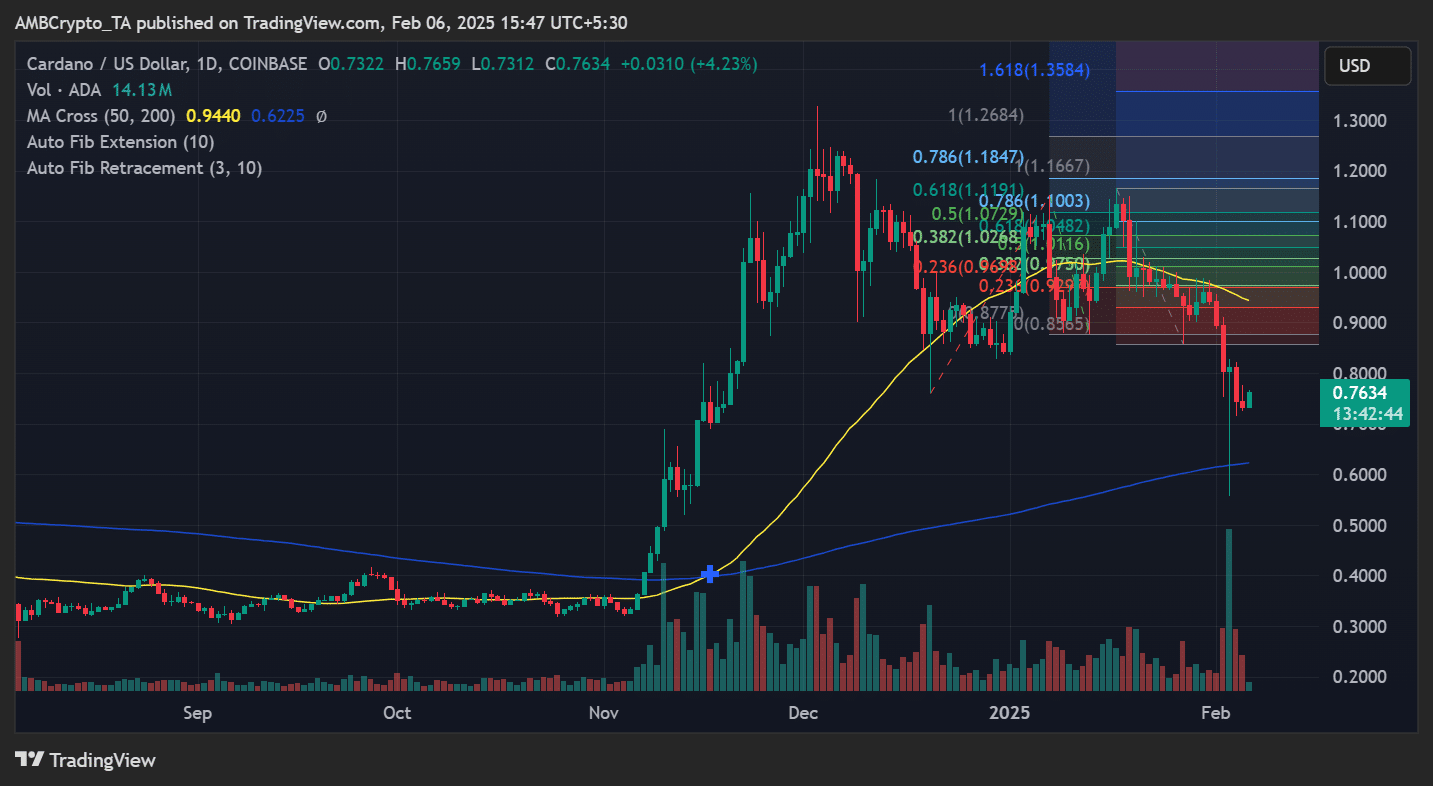
At press time, Cardano[ADA] was trading at $0.7634, marking a 4.23% intraday gain. However, its price remains below the 50-day moving average (MA) at $0.9440, which serves as a critical resistance level.
A decisive break above this level could confirm a bullish continuation, potentially propelling ADA toward $1.00-$1.10, a major Fibonacci extension zone.
Source: TradingView
The 200-day MA at $0.6225 acts as strong support, with recent price action bouncing off this level.
If ADA maintains momentum and reclaims the 0.786 Fibonacci retracement level at $1.18, it could signal a push toward $1.30-$1.35, where the 1.618 Fib extension aligns with previous highs.
Momentum indicators: RSI, MACD, and DMI
The Relative Strength Index (RSI) currently stands at 33.36, indicating that Cardano is nearing oversold territory.
Historically, readings below 35 have preceded strong price rebounds. If buying pressure increases, ADA could witness accelerated upside movement.
Meanwhile, the MACD histogram shows weakening bearish momentum. A bullish crossover in the MACD lines could strongly confirm an uptrend, increasing the probability of a sustained rally.

Source: TradingView
The Directional Movement Index (DMI) reflects a mixed trend, with the ADX at 33.13, suggesting that market strength remains intact.
However, the +DI (green) needs to cross above -DI (red) to confirm bullish control.
Can ADA hit $1.50?
If ADA clears its $1.00-$1.10 resistance zone, it could pave the way for a move toward $1.30-$1.50, aligning with historical price action and Fibonacci extensions.
However, failure to sustain above key levels could lead to a retest of $0.70-$0.65 support, where buyers previously stepped in.
– Read Cardano (ADA) Price Prediction 2025-26
Watch for breakout confirmation
ADA is at a crucial juncture, with rising open interest, key moving averages, and momentum indicators suggesting a potential breakout. Traders should watch for a clean break above $0.94-$1.00 for confirmation.
If bullish momentum sustains, a parabolic rise toward $1.30-$1.50 could be in play. However, rejection at resistance could trigger a pullback, making $0.70 a key downside level to monitor.