
- A break below $2,345 could push 2.03M ETH addresses into losses, intensifying market sell pressure.
- Ethereum’s new address creation was declining, signaling reduced network activity and potential demand weakness.
Ethereum [ETH] is at a critical juncture, with its price hovering near $2,350. If it falls below $2,345, over 2 million investors holding 58.88 million ETH could find themselves in the red.
Given this significant threshold, analyzing ETH’s price trend, on-chain data, and market sentiment is essential.
Key support and resistance levels
Ethereum’s price chart showed that it recently bounced from a low of $2,300 but remained below key moving averages. The 50-day Moving Average (MA) stood at $2,678, while the 200-day MA was at $3,271, indicating a bearish trend in the short term.
ETH faces immediate resistance around $2,400, with stronger resistance at $2,500. If bullish momentum builds, reclaiming these levels could shift sentiment positively.

Source: TradingView
On the downside, losing the $2,345 support level would push ETH into a vulnerable zone, where the next significant support sits at around $2,250.
A break below this could accelerate selling pressure, triggering further downside toward the $2,100-$2,150 range.
Ethereum on-chain metrics signal caution
Data from IntoTheBlock revealed that 82.76% of ETH holders were still in profit at current levels, but a drop below $2,345 would change this dynamic significantly.
Over 17.14% of addresses holding 13.14 million ETH are already out of the money, and more could follow if the price weakens further.
Additionally, Glassnode’s data on new Ethereum addresses shows a declining trend. After peaking above 150,000 daily new addresses in early January, the count has dropped below 100,000.
This suggests lower network activity and reduced new demand for ETH, which could limit bullish momentum in the near term.
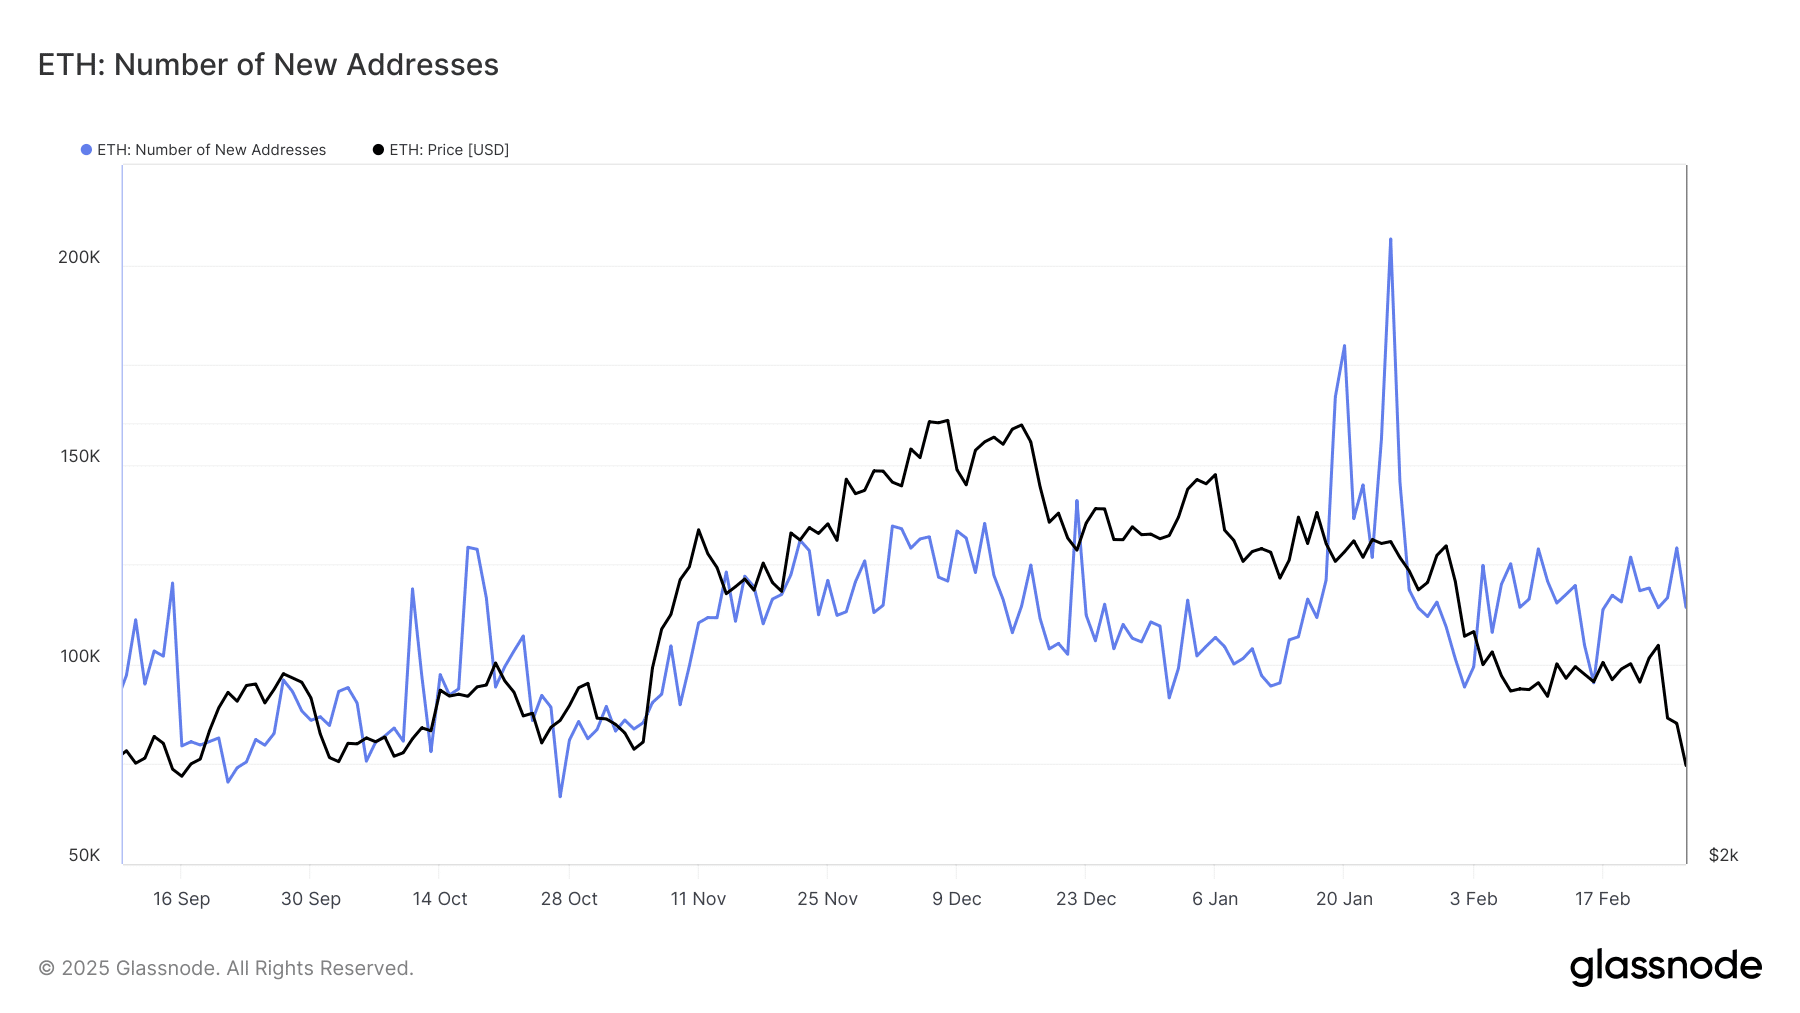
Source: Glassnode
Market sentiment and potential scenarios for Ethereum
At the time of writing, the MACD indicator remained in the negative territory, reflecting ongoing bearish momentum. However, the Average Daily Range (ADR) at 132.92 suggested potential volatility, meaning ETH could see sharp price swings in either direction.
For ETH to recover, buyers must step in at the $2,345 level and push prices above the immediate resistance. If Ethereum holds this support and new demand increases, a reversal could target $2,500 and beyond.
However, if selling pressure intensifies, ETH could break lower, bringing further downside risks.
Conclusion
Ethereum is at a crucial price level, and the next few trading sessions will determine its direction. A sustained break below $2,345 could lead to a sharper decline while holding above it might encourage a short-term recovery.
Investors should watch on-chain activity, market sentiment, and key technical levels closely to gauge the next move in ETH’s price action.