- ADA looks ready to rebound, as the TD Sequential indicator flashes a buy signal on the 4-hour chart.
- Will ADA rise further and reach higher targets?
Cardano [ADA] was forming a symmetrical triangle at press time, indicating a consolidation phase before a potential breakout. This triangle pattern is a typical precursor to a significant price move.
This further suggests that ADA may break out towards higher levels once the apex is reached.

Source: Coinglass
The price action within the triangle indicated a balance between buying and selling pressures, but the eventual breakout is likely to provide the necessary momentum for a surge.
Moreover, the EMA cross visible in the showed that the 9-period EMA was above the 26-period EMA, signaling a bullish crossover.
This suggests that the short-term trend is turning upward, further supporting the possibility of a breakout. The cross implies a shift in momentum toward the buyers, indicating that ADA might soon experience a price increase.
The Crypto Fear & Greed Index at 51 further confirms the neutral sentiment, which aligns with the stability within the triangle.
Although this index does not signal extreme bullishness, it reflects a cautious optimism that may push ADA higher as market conditions stabilize.
A reversal on the horizon
Also, per analyst Ali Martinez, he TD Sequential indicator flashed a buy signal (A13) on ADA’s 4-hour chart. The TD Sequential is used to identify trend exhaustion points and potential reversals.
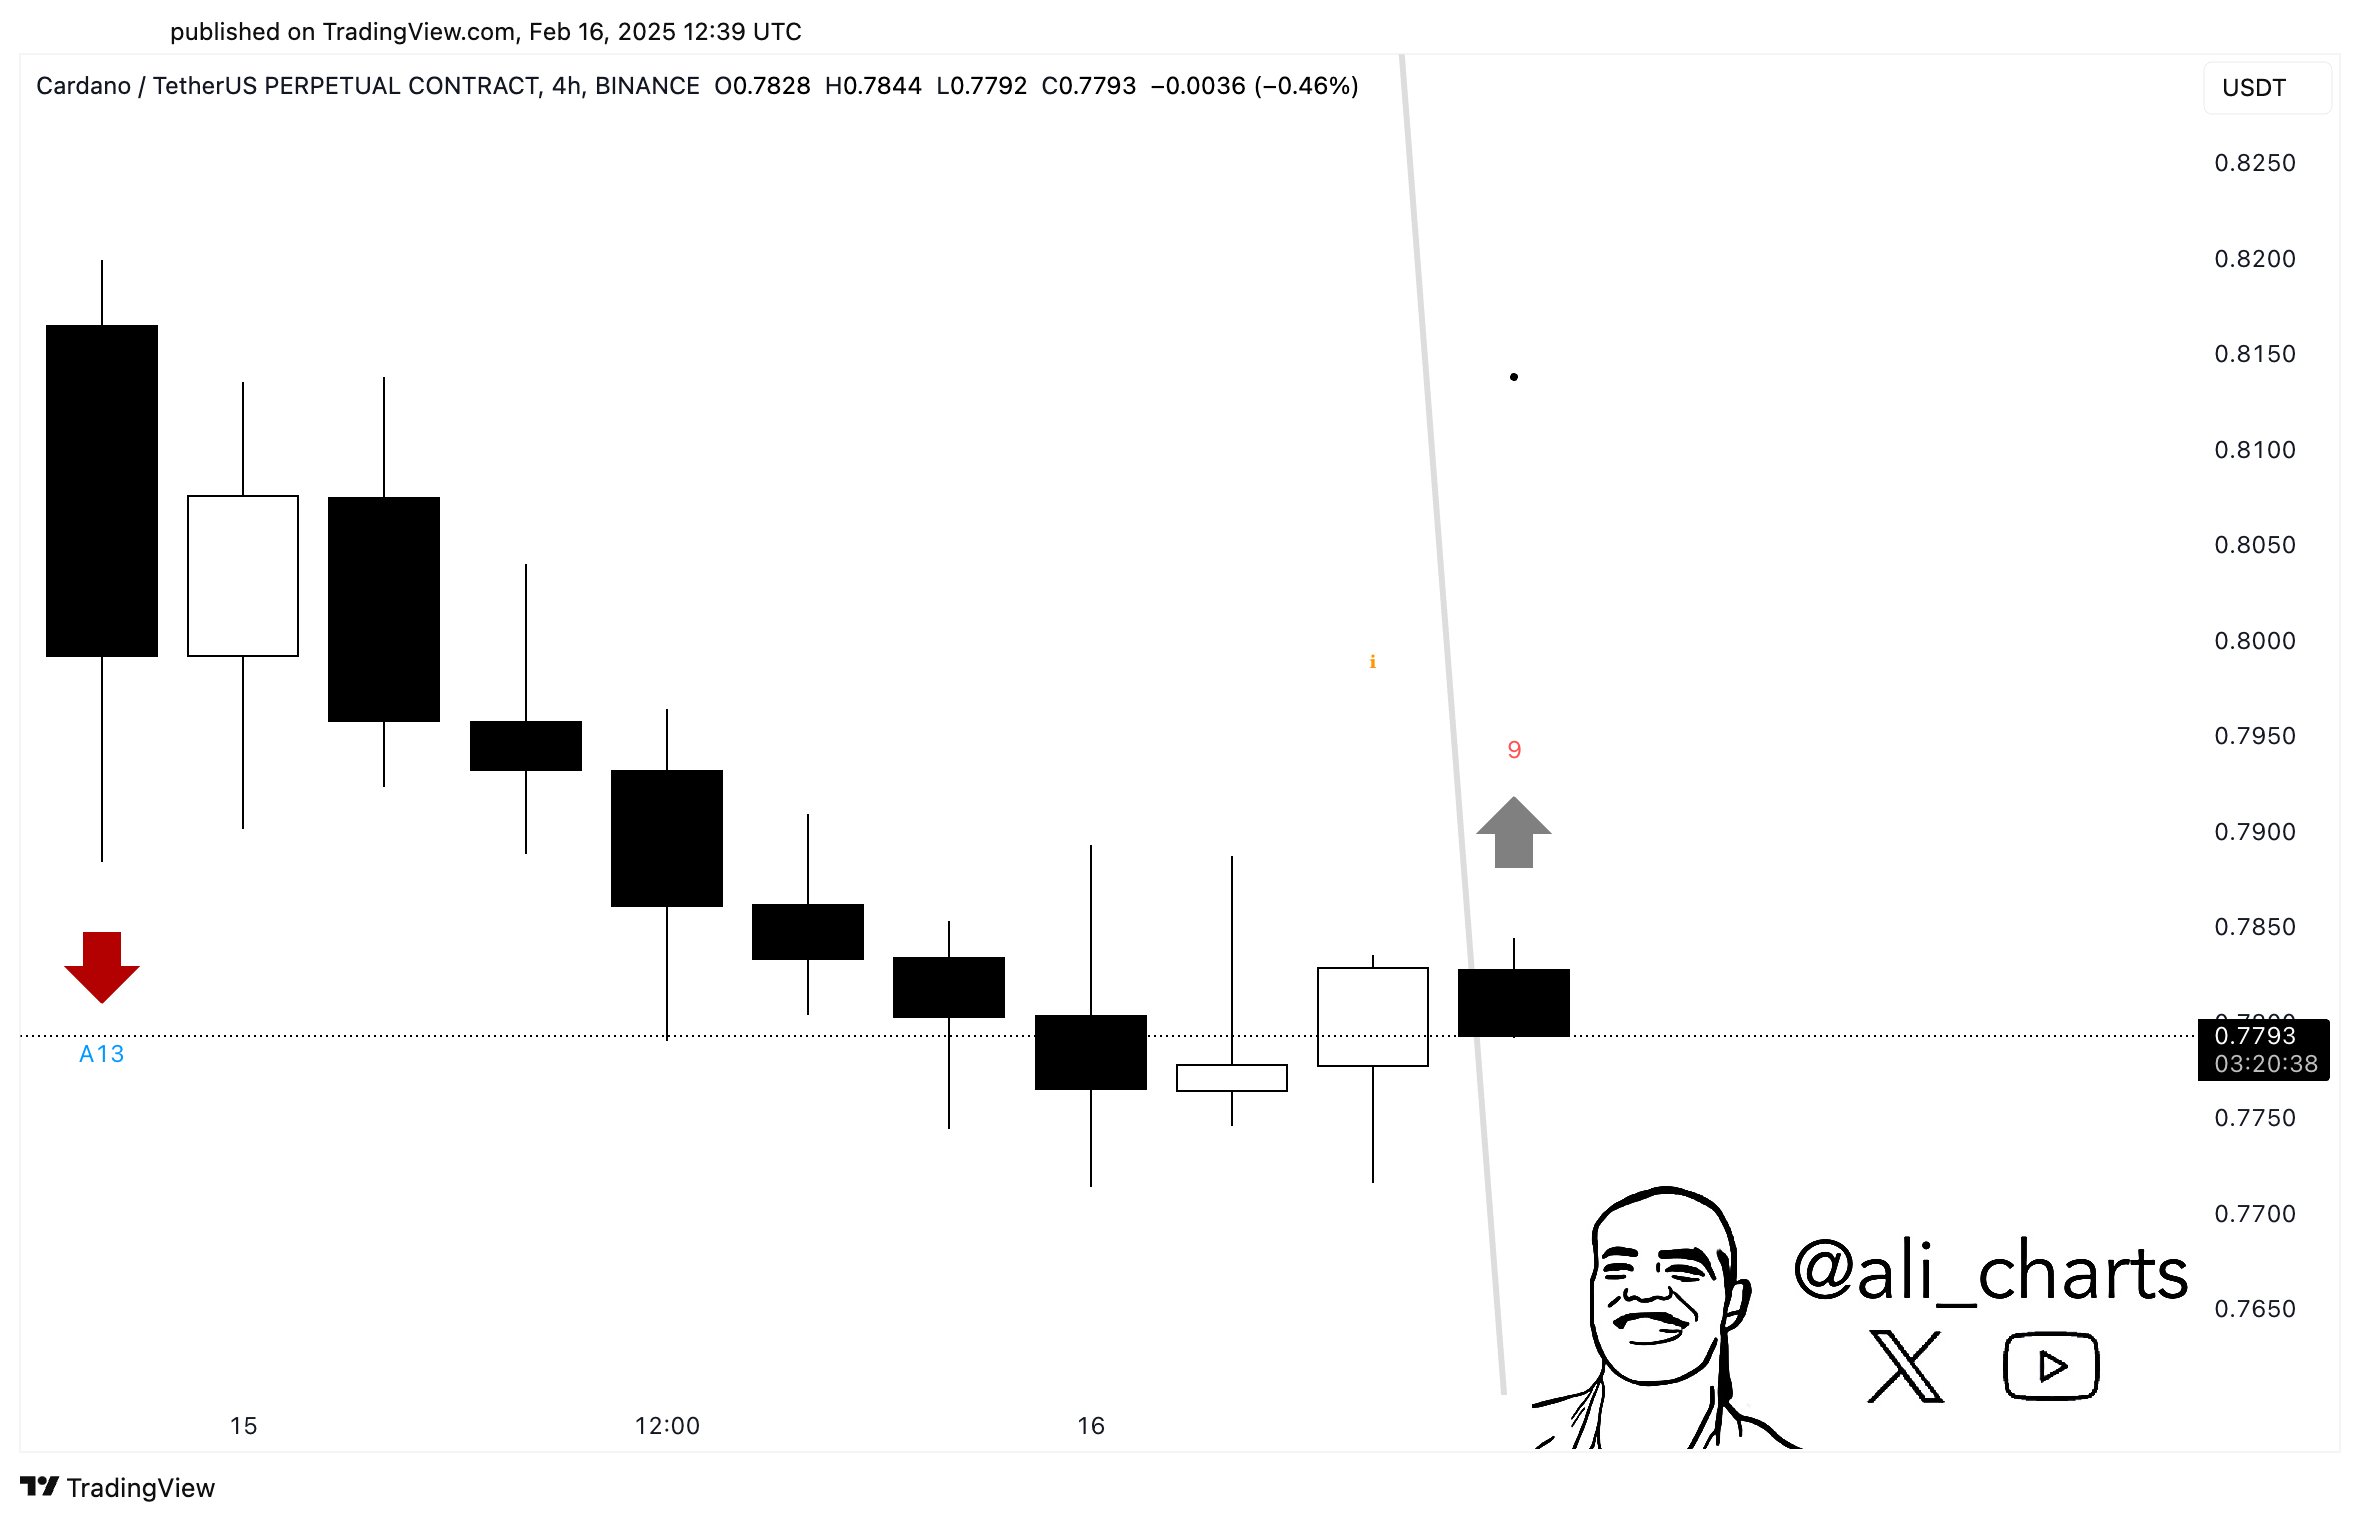
Source: Ali Charts
Therefore, the appearance of a buy signal indicates that the bearish trend might be coming to an end for bullish reversal.
This aligns with the price action and the EMA crossover, supporting the case for ADA to break out from its consolidation and head towards higher targets of $0.85 and $0.90.
Can short squeezes drive ADA higher?
Sequentially, ADA’s liquidation heatmap highlighted a strong concentration of liquidations around the $0.80 to $0.82 range, suggesting that a significant number of traders were positioned in this area.
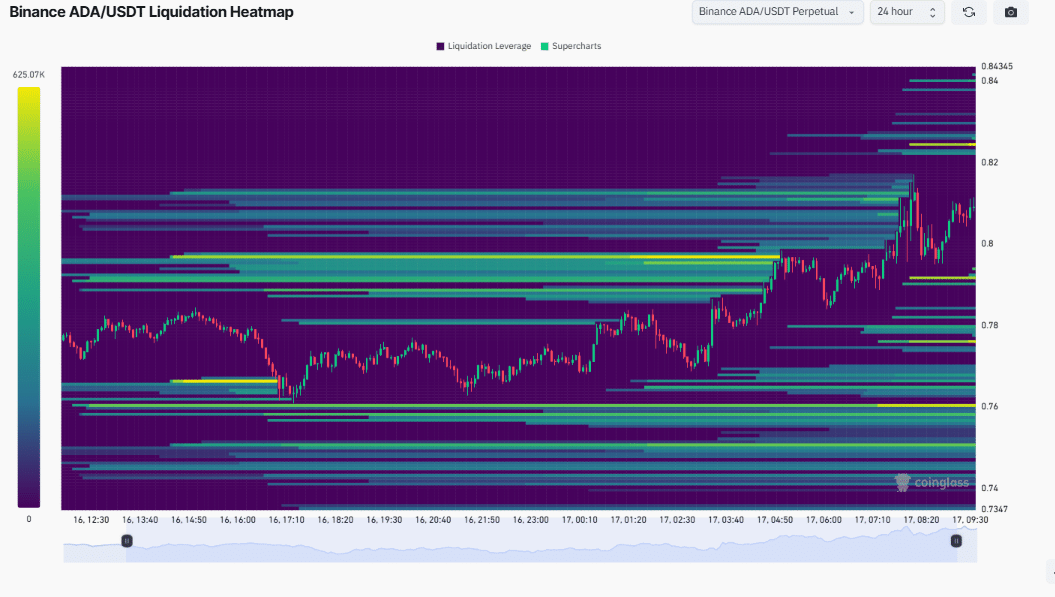
Source: Coinglass
If ADA breaks through this range, it could trigger additional buying pressure due to the forced closure of short positions. This creates a feedback loop, pushing the price even higher.
The heatmap also revealed substantial liquidation levels below the current price. While there is some selling pressure, the market has more room for the upside before triggering liquidation cascades.
This aligns with the potential breakout we expect from the symmetrical triangle pattern.
Key indicators for a bullish move
Analysis of ADA’s Open Interest and volume implies that more traders are entering the market and taking positions in the asset, indicating confidence in its price movement.
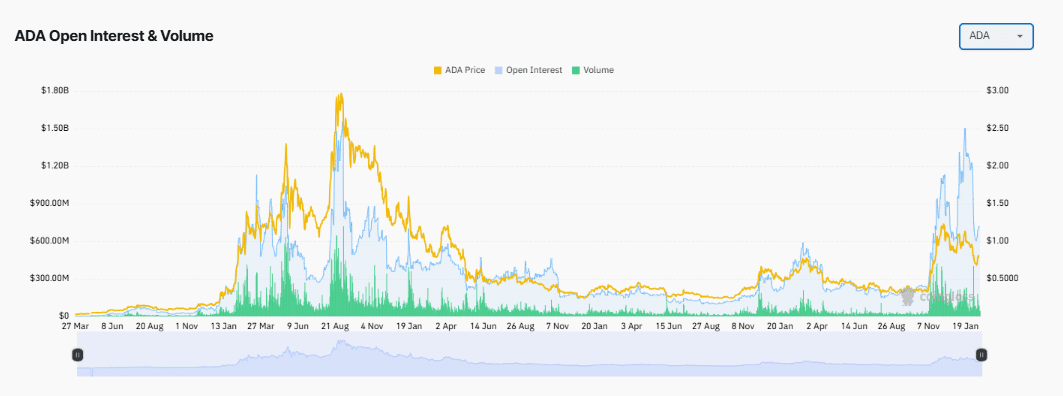
Source: Coinglass
Coupled with increasing volume, which is a sign of active participation, this suggests that there is strong support for ADA’s bullish outlook.
As more positions are opened, the liquidity and momentum could propel ADA towards its targets.
The chart further shows a substantial uptick in volume in recent trading sessions, highlighting that the buying interest is intensifying.
This volume surge provides confirmation of the price action and TD Sequential buy signal. It suggests that ADA could indeed be on the verge of a breakout, especially if the current trend continues.
In conclusion, if ADA breaks above the upper boundary of the triangle, it could target $0.85 in the near term.