
- At press time, MKR was testing support at $1,279 as cost basis clusters hinted at heavy investor positioning between $1,300 and $1,500
- MFI at 29.04 hinted at oversold conditions and by extension, a potential bounce on the charts
Maker’s [MKR] price action over the past few weeks has been volatile, with the crypto noting a reversal on the charts after hitting a mid-February low. In fact, the token rallied to $1,700, only to retrace back to $1,350 – A sign of heavy engagement from investors at key price levels.
Using the Cost Basis Distribution metric, we can analyze how MKR holders are reacting to price movements, which supply clusters have been absorbed, and where new ones are forming. The insights from this analysis can give us a clearer outlook on where MKR might be heading next.
Cost Basis Distribution – Where are investors positioned?
The Cost Basis Distribution chart provides us a detailed breakdown of how Maker investors have engaged with price movements. The supply clusters highlighted regions where buyers have historically entered the market and where distribution has occurred.
The data suggested that a significant number of investors accumulated MKR when it was trading between $1,300 and $1,500. This zone has acted as a critical accumulation zone. And, as the price approaches this range again, investor behavior will determine whether support holds or if further downside is likely.
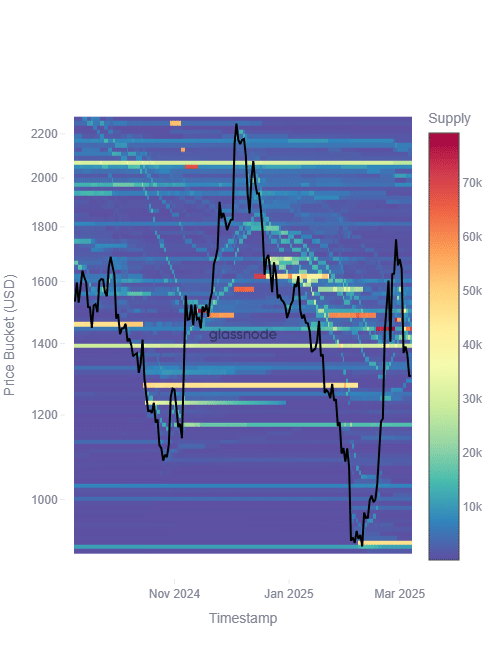
Source: Glassnode
Above $1,500, the supply clusters seemed to thin out – Indicative of the fact that resistance could form if price attempts to reclaim these levels.
Altcoin’s support and resistance levels
At the time of writing, MKR was trading at $1,279, following a 1.31% decline in the last 12 hours. The 50-day moving average [MA] sat at $1,331, with the same acting as a resistance level on the charts.
A breakout above this level could shift momentum in favor of the bulls. Meanwhile, the 200-day MA at $1,471 will remain a major long-term resistance zone, marking an area where profit-taking is likely to occur.
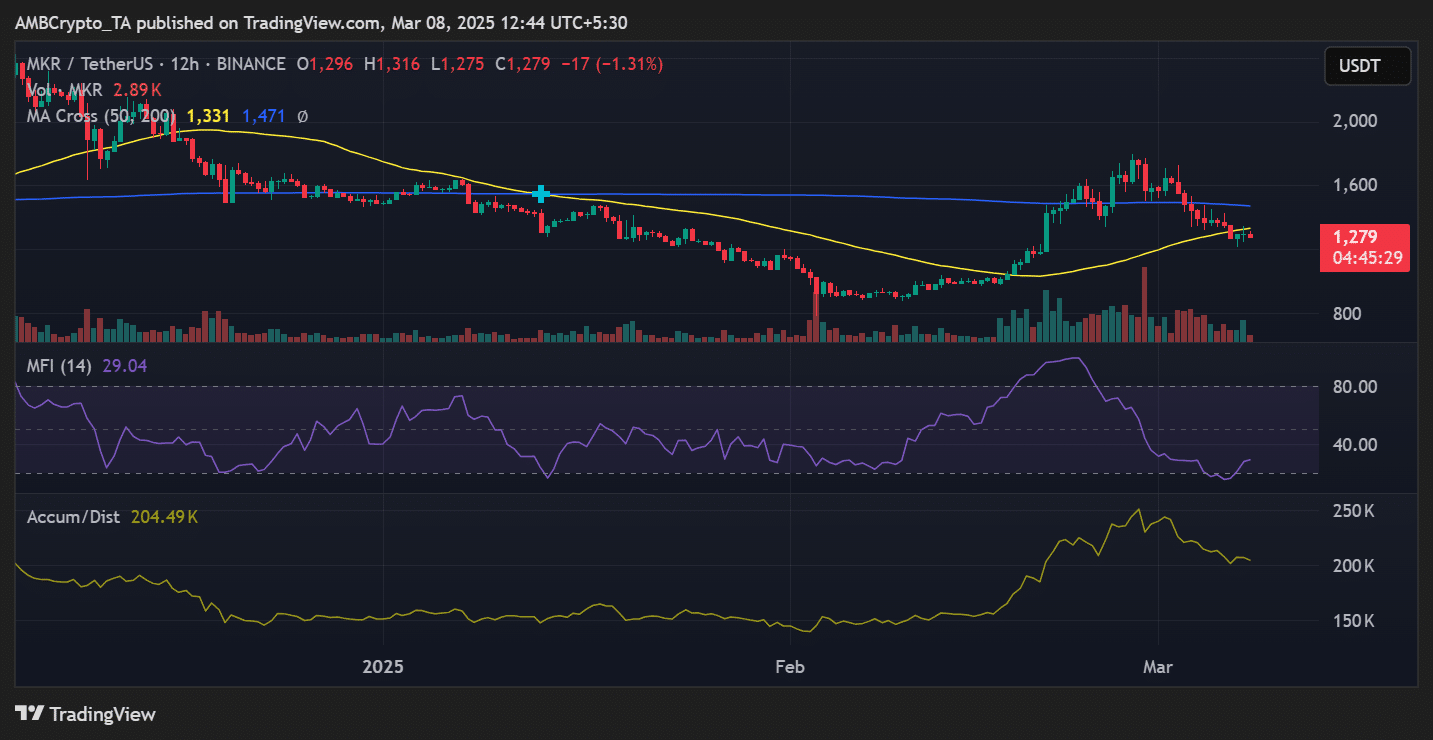
Source: TradingView
The Money Flow Index [MFI] had a reading of 29.04, suggesting that MKR may be approaching oversold territory.
If buying pressure increases, a potential bounce from the press time levels could push the price towards $1,350–$1,400, where the next major supply cluster sits. However, if sellers remain dominant, MKR could test $1,200 – A region that previously acted as a strong support.
Investor engagement and market sentiment
A deeper look at investor behavior revealed that recent accumulation trends hinted at a mix of long-term holders absorbing supply and short-term traders rotating out at resistance levels. This dynamic means that MKR’s price trend will be dictated by whether accumulation remains strong in the $1,300–$1,500 range.
If MKR successfully holds the lower bounds of this range and buying pressure intensifies, the token could attempt another breakout towards $1,600–$1,700. However, failure to maintain support at its press time levels could lead to a deeper correction below $1,200. This is where the next demand zone is likely to form.
What’s next for MKR?
Maker’s price is at a crucial point right now, with its Cost Basis distribution highlighting key accumulation and distribution zones. The next move will depend on whether buyers can sustain demand in the $1,300–$1,500 range or if further downside is necessary to establish a new demand zone.
For traders and investors, monitoring the MFI, moving averages, and cost basis clusters will be essential to identifying trend shifts. If bullish momentum returns, a push above $1,400–$1,500 could open the door for a retest of $1,700.
However, sustained weakness may lead to a prolonged correction towards $1,200 or lower. As market conditions evolve, the response of MKR investors at key levels will be crucial in shaping its next major move.