
In brief
- Prediction markets show a nearly 50-50 split on Ethereum reaching $3,000 versus dropping to $2,000 by year-end.
- Technical indicators suggest bearish pressure working against the price ETH at the moment.
- As it stands, charts indicate it’s a bit more likely to see a dip than a spike, at least in the short term.
Ethereum is one of the few crypto assets trading in the green today, and with the price of ETH hovering around the $2,500 mark for most of June, the question on most holders minds is, naturally: Where does Ethereum go next?
Prediction markets, platforms that allow for the trading of event contracts, provide one window to view current sentiment.
On Myriad, a prediction market developed by Decrypt’s parent company Dastan, predictors are remarkably split on Ethereum’s fate. A market titled “Ethereum’s next hit: moon to $3000 or dip to $2000?” went live on Myriad on June 19 and has so far attracted a little more than $13K in trading volume. At the moment, traders have set the odds for ETH dropping to $2,000 before the end of the year to roughly 51% while the odds of Ethereum mooning to $3,000 stand at 49%.
This razor-thin margin reflects the genuine uncertainty gripping the market—neither bulls nor bears have a convincing edge.
Interestingly enough these balanced odds persist despite Ethereum’s recent network upgrades and growing institutional interest.
Ethereum, the asset, is second only to Bitcoin by market capitalization, currently valued at $293 billion to Bitcoin’s $2.1 trillion. It’s the only crypto asset besides Bitcoin that currently has spot ETFs trading in U.S. markets (though that might soon change with the rush of altcoin ETF applications now before the SEC).
Ethereum, the network, has also seen significant improvements recently, with the Pectra upgrade going live last month and increasing validator caps and expanded network data capacity.
And yet the market remains unconvinced about directional momentum for ETH, with lots of profit-taking triggered just below the significant psychological level of $3,000.
Ethereum to $3,000 or $2,000: What do the charts say?
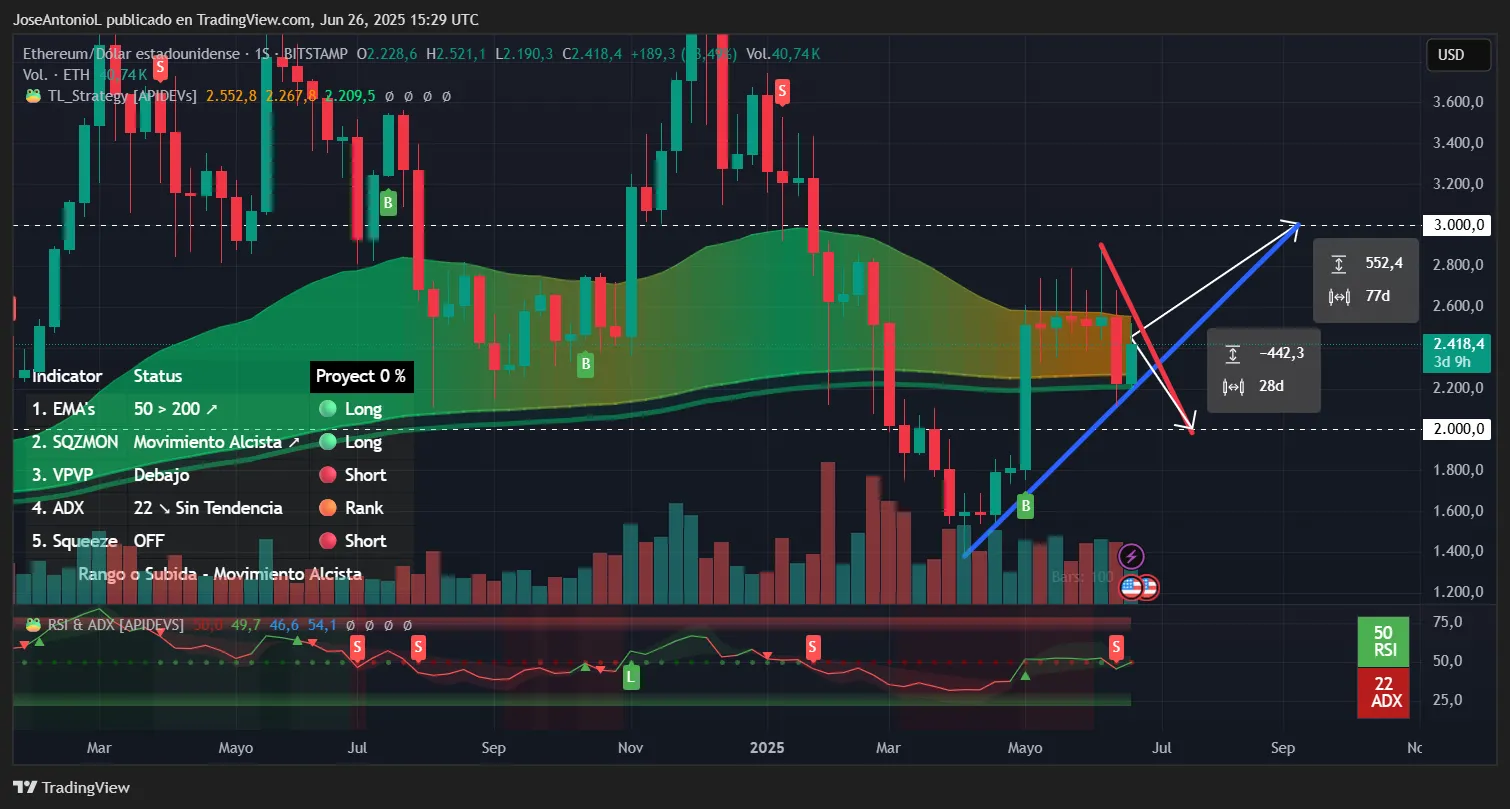
From a pure price movement perspective, the bearish scenario appears just a tiny bit more probable in the immediate term. To reach $3,000, Ethereum needs to gain $552 (approximately 23%) from current levels. Based on the blue support trendline shown in the chart, this would require nearly 77 days of sustained bullish momentum.
Conversely, reaching $2,000 requires only a $442 drop (about 18%). Given the bearish channel formation over the past three weeks, this downside target could materialize within a month if selling pressure intensifies.
This resistance line (in red) is also a bit more pronounced, meaning the weekly highs dropped faster during the last three weeks as opposed to a slower price appreciation trend that has been up since March (blue line). This may point to a short term price correction in the middle of a more sustained bullish trend. Remember, as much as holders want to believe otherwise, nothing is always “up only.”
Also, the $2,800 mark has proven to be a formidable resistance level since May, which sadly is not enough to meet the Myriad market resolution criteria. It’s gotta hit $3,000, which may not be easy. While Ethereum briefly traded above $3,000 in early 2025, it actually spent time below $2,000 from March to April until the spike on May 10, showing the market’s willingness to test lower levels.
The Ethereum chart tells a cautious tale
Under theoretical ceteris paribus conditions—assuming all external factors remain constant, which they never do—the technical picture leans bearish in the near term. Here’s what the weekly chart reveals:
The Average Directional Index, or ADX, sits at 22, below the crucial 25 threshold that confirms trend strength. This reading suggests Ethereum lacks a strong directional trend—neither bulls nor bears have taken firm control, and the current longer bullish trend is losing strength. For traders, an ADX below 25 typically means choppy, range-bound action rather than trending moves.
The Relative Strength Index, or RSI, reads 49.7, placing it squarely in neutral territory. RSI measures momentum by comparing recent gains to recent losses. Readings above 70 suggest overbought conditions where pullbacks often occur, while readings below 30 indicate oversold levels that may precede bounces. Ethereum’s near-50 reading shows balanced momentum without extremes and pretty much mimics the state of the Myriad market—undecided.
Looking at the Exponential Moving Averages, or EMAs, the 50-week EMA sits above the 200-week EMA—traditionally a bullish configuration called a “golden cross.” However, the narrowing gap between these averages is concerning. When shorter-term averages converge toward longer-term ones, it often signals weakening bullish momentum.
The Squeeze Momentum Indicator shows “OFF” status, indicating volatility has already been released. But the indicator, alongside the ADX, shows there is still a bullish trend in play, weak or strong.
While prediction markets show an even split between moon and doom scenarios, the technical picture suggests caution. The weak ADX reading, neutral RSI, and previous struggles with the $2,800 resistance level paint a picture of consolidation rather than trending action. In pure technical terms, the path to $2,000 appears easier than reaching $3,000.
However, crypto markets rarely follow textbook patterns. Institutional adoption, network upgrades, and macroeconomic shifts could quickly invalidate any technical setup. For now, traders should watch the $2,200 support and $2,800 resistance as key battlegrounds that will likely determine Ethereum’s next major move.
Disclaimer
The views and opinions expressed by the author are for informational purposes only and do not constitute financial, investment, or other advice.
Daily Debrief Newsletter
Start every day with the top news stories right now, plus original features, a podcast, videos and more.