
- NEAR was at a critical position on the chart as it attempted to reclaim a support level that could determine its rally.
- On-chain metrics suggested mixed market signals, placing NEAR at a crossroads regarding its next move.
Near Protocol [NEAR] has declined 3.80% in the past 24 hours, with its press time valuation at $3.38.
This bearish movement continued the downward trend NEAR has experienced over the past month, with a 36.94% decline.
Analysis showed mixed signals across multiple market metrics, which could delay a possible rally or cause further market declines.
NEAR attempts to reclaim higher levels
After trading for an extended month-long period within a consolidation channel—where the price oscillated between a support at $3.50 and a resistance level of $8.30—NEAR recently breached this support level and trended lower.
However, the asset attempted to reclaim this support at the time of writing, trading back within the consolidation channel and forming a new high.
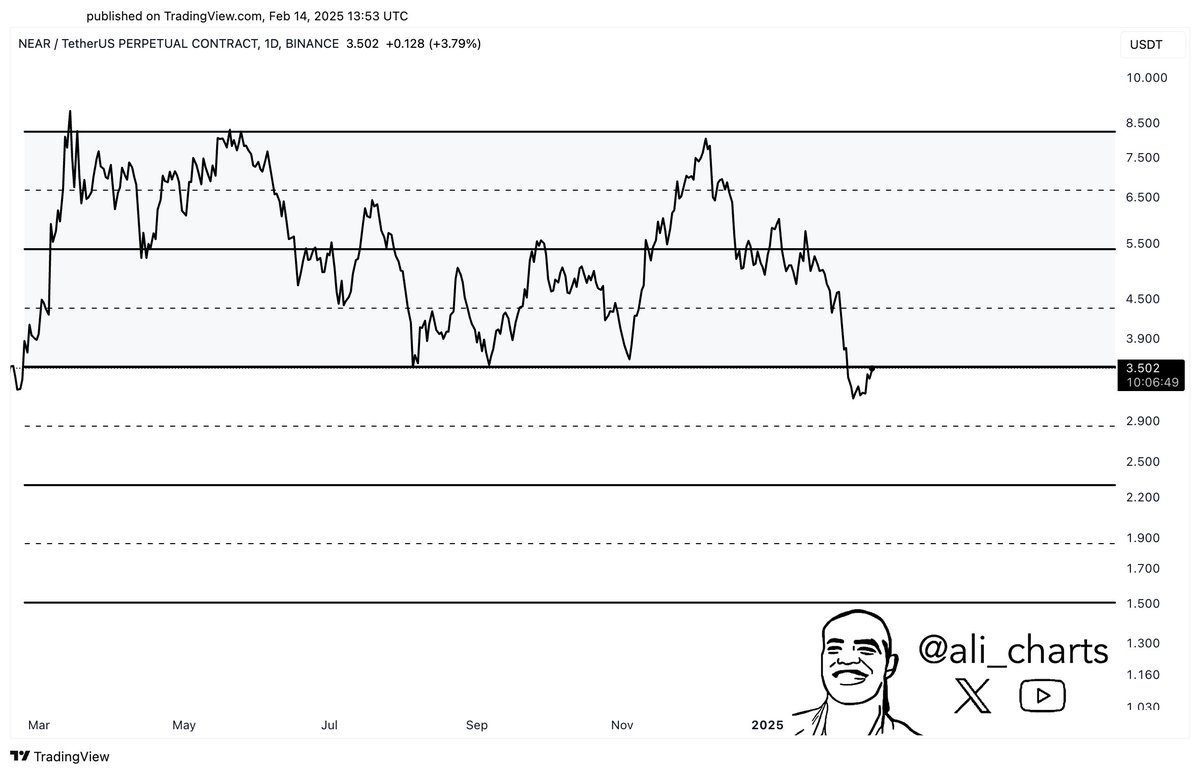
Source: TradingView
Another possibility is that this slight price pullback is NEAR forming a lower high before continuing its downward trend.
AMBCrypto analyzed additional factors that could influence the price trend—whether upward or downward—and found a mixed sentiment in the market.
Mixed market sentiment creates uncertainty
Several market indicators suggest mixed sentiment. At the time of writing, the Funding Rate showed that sellers were funding the market.
This is based on the negative Funding Rate of -0.0170. A negative reading indicates sellers are highly convinced that NEAR’s price will decline shortly.
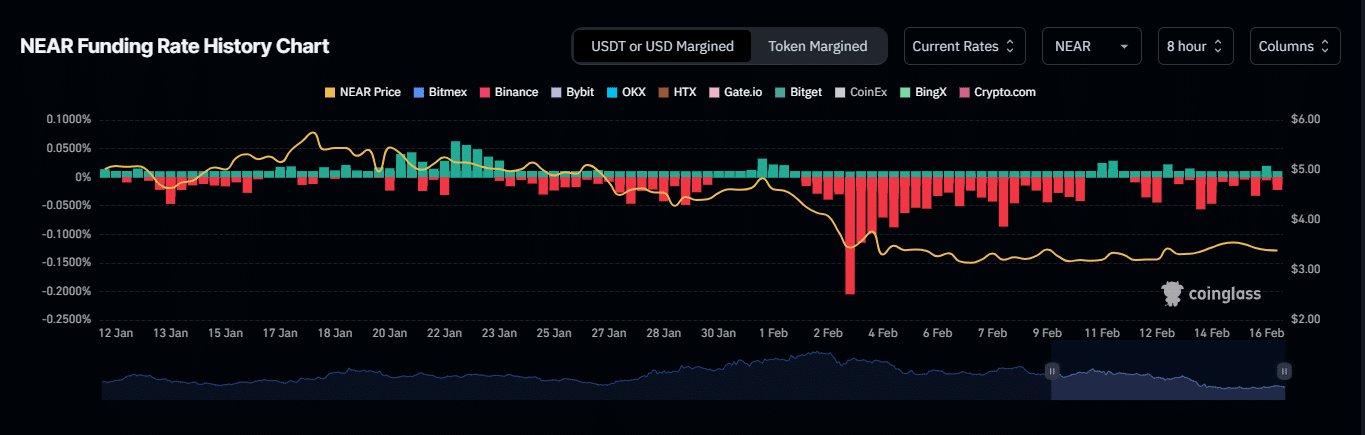
Source: Coinglass
Similarly, there have been more long liquidations in the market across all time frames. In the past 24 hours alone, a total of $137,140 worth of long contracts was forcefully closed, compared to $24,170 in short liquidations.
This high disparity suggests NEAR’s bears are in control, increasing the likelihood of further price declines.
However, the Taker Buy-Sell Ratio indicates that bulls remain active, as buying volume has surpassed selling volume over the past 24 hours.
This ratio is measured on a scale where 1 represents a neutral zone. A reading above 1 suggests buyers are more active, while a reading below 1 indicates seller dominance.
NEAR’s current Taker Buy-Sell Ratio stood at 1.004, meaning the market has been slightly bullish in the past 24 hours.
Decline in active addresses adds to pressure
There has been a significant decline in the number of Daily Active Addresses on the NEAR chain.
A drop in active addresses, especially when the asset’s price is falling, suggests reduced network activity as traders likely exit their positions.
According to Artemis, between February 13 and the latest data at press time, active addresses have dropped by 1.2 million—from 4.2 million to 3.0 million.
This suggests that a notable portion of this decline comes from sellers leaving the market.
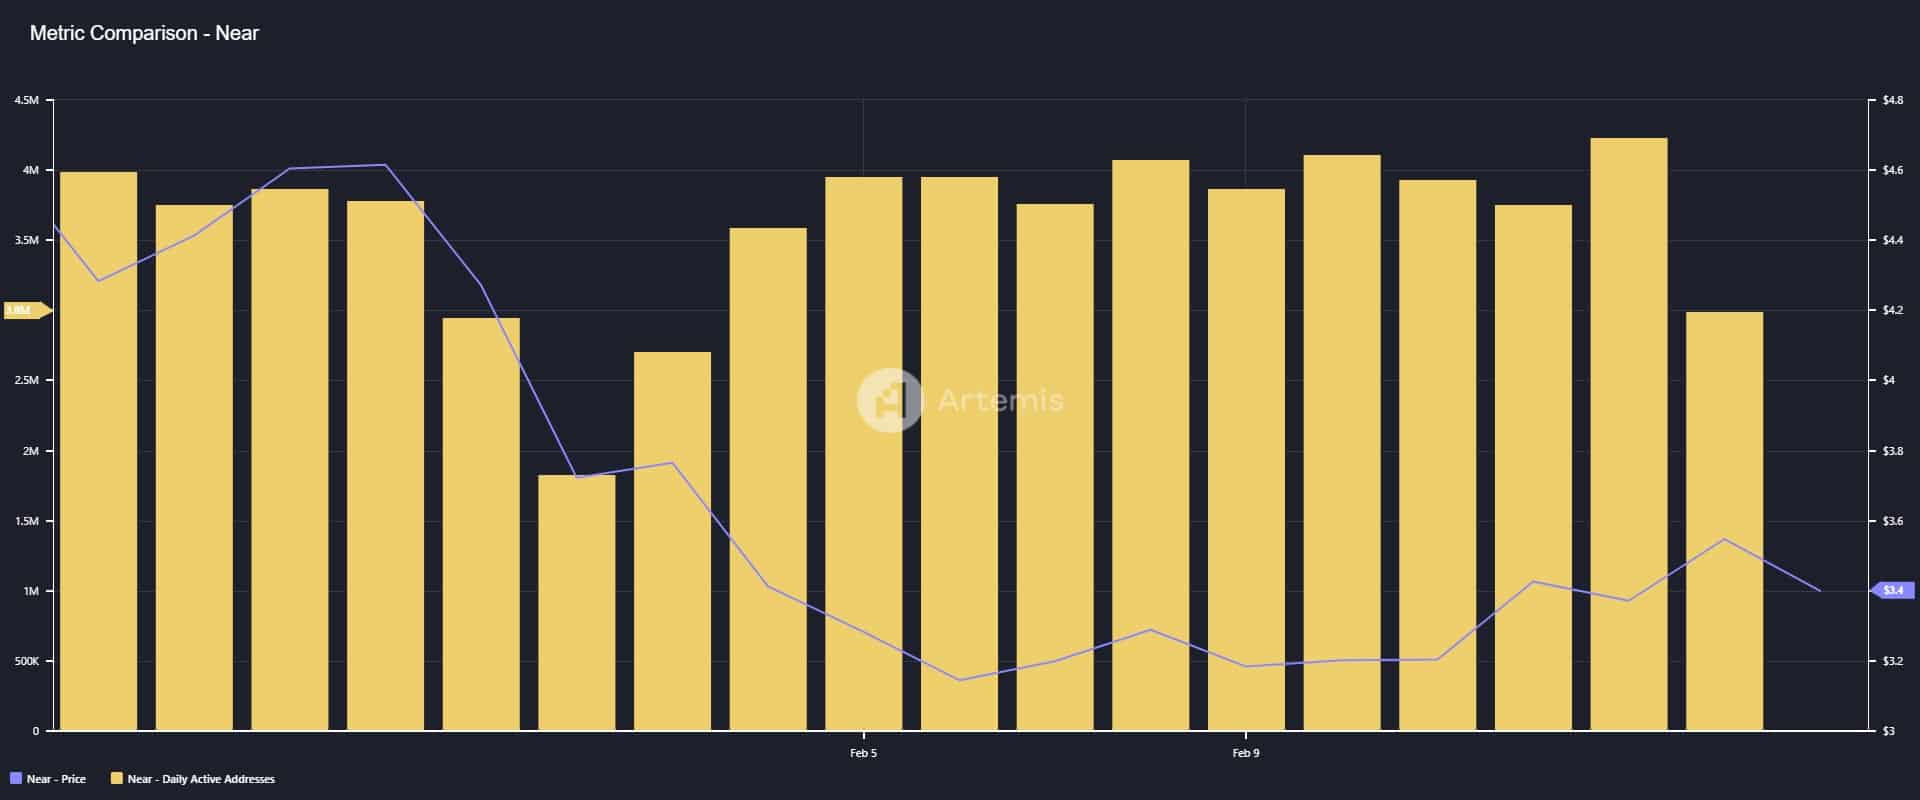
Source: Artemis
If active addresses continue to decline, it could add more downward pressure on the asset as more sellers enter the market.