
- PEPE formed a bullish inverse head-and-shoulders pattern, targeting $0.000010.
- Despite sell-offs, PEPE’s market showed potential for a breakout above $0.0000070.
Pepe [PEPE] is currently the third-largest meme token by market capitalization, attracting significant attention from cryptocurrency investors. At press time, PEPE was trading at $0.000006862, reflecting a 3.09% decrease in the past 24 hours.
The token’s market shows considerable price volatility, supported by a trading volume of $819 million. This active market participation highlights strong investor interest and positions PEPE as a focus for both traders and analysts.
PEPE forms a bullish pattern, what next?
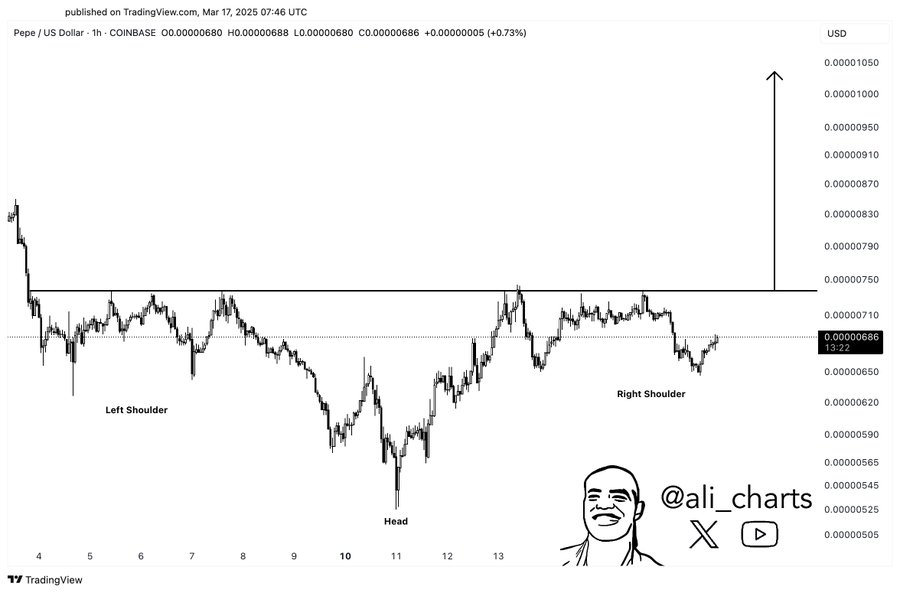
PEPE has recently been forming an inverse head-and-shoulders pattern, as noted by crypto analyst Ali Martinez.
This pattern is widely considered a bullish signal, indicating the possibility of an upward price breakout. The price has tested the right shoulder in recent trading sessions and is approaching a key resistance level.
If PEPE successfully breaks through this resistance, analysts suggest the coin could surge to $0.0000105, indicating substantial upward momentum.
Source: X
Martinez further highlighted that if PEPE breaks the $0.0000075 resistance, it could trigger a rally of up to 40%. With a target price set at $0.000010, the coin has a clear potential path for gains.
PEPE faces sell-offs, market sentiment influences price trends
Despite its bullish technical outlook, recent on-chain data reveals a significant shift in investor sentiment. PEPE whales, or large holders, have begun selling off their positions after months of poor market performance.
After peaking at $0.00002825 in December 2024, PEPE has faced a steep decline of over 76%.
The sell-off by major holders has raised concerns about waning investor confidence in the memecoin. Despite achieving listings on major exchanges, this significant price drop indicates a potential loss of faith.
Transaction data reveals that large transactions often coincide with price movements, reflecting shifts in market sentiment. As transaction volumes increase, prices tend to follow, suggesting these trades are influencing price trends.
This pattern could signal the beginning of a larger rally, making it essential to monitor the memecoin’s ability to sustain momentum.
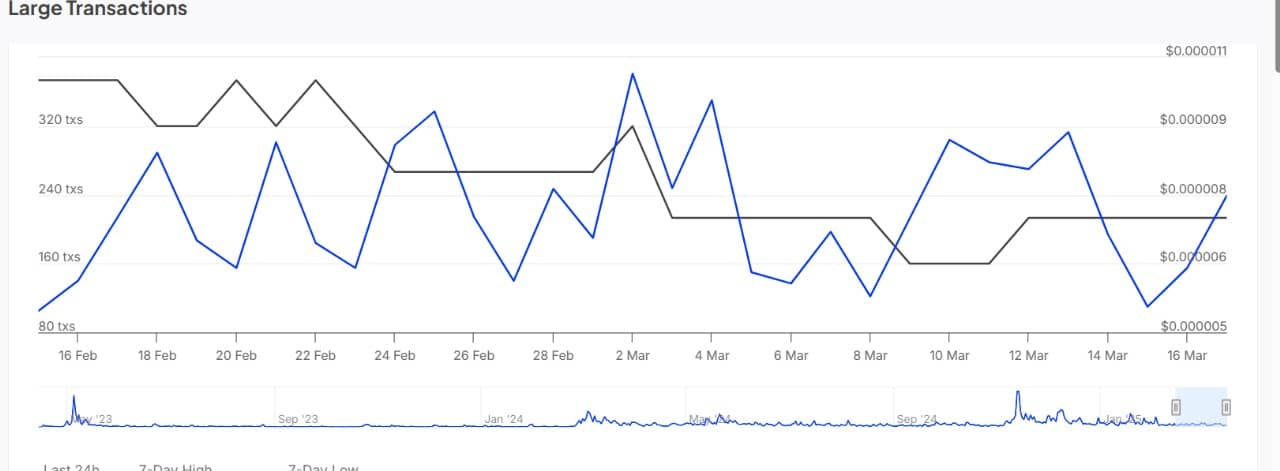
Source: IntoTheBlock
Technicals show a neutral market
At the time of writing, the Relative Strength Index (RSI) was at 51.06, signaling a neutral market condition. This suggests that PEPE is neither overbought nor oversold, making it vulnerable to both bullish and bearish movements.
The Moving Average Convergence Divergence (MACD) indicator was showing slight bullish momentum, with the MACD line positioned above the signal line.
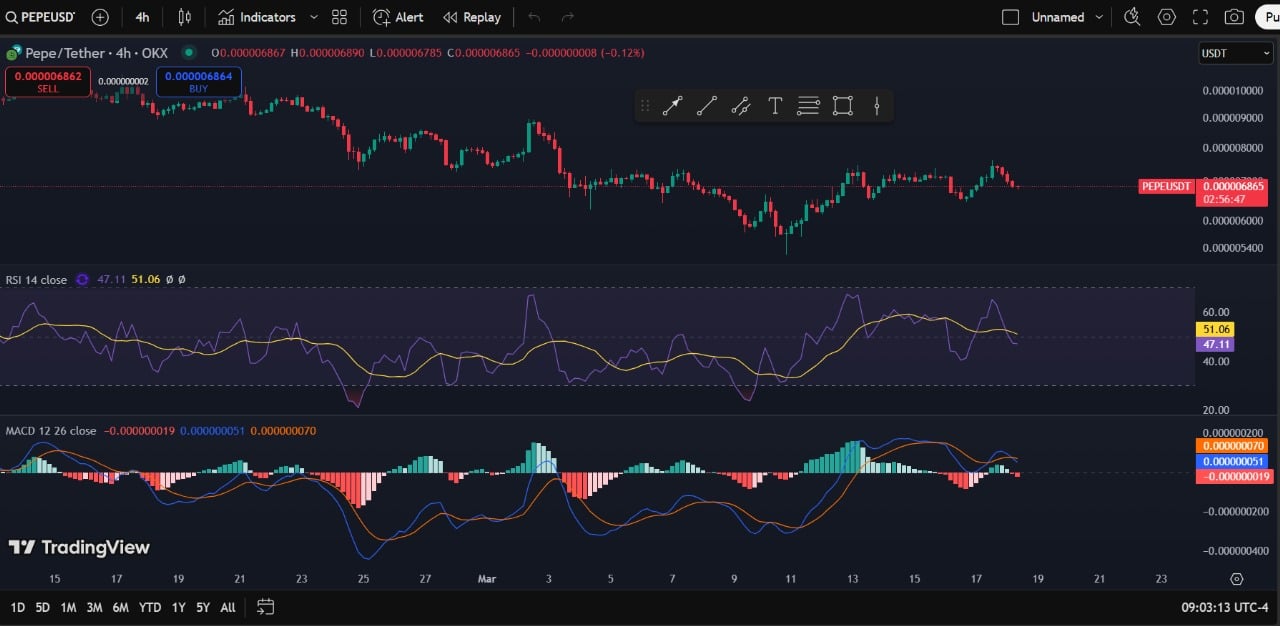
Source: TradingView
PEPE’s price is currently within a narrow range, lacking strong momentum. The next resistance level is around $0.0000070 USDT, and a breakout could lead to further gains.
If the MACD weakens and the RSI drops below 40, the price may drop back to $0.000006.