- Traders have built $85 million worth of short positions in the hope that SOL’s price won’t cross the $113 level.
- At press time, traders were holding more short positions than long positions in the market.
Solana [SOL], the sixth-largest cryptocurrency by market cap, appears to be continuing its downward momentum due to bearish price action.
At the time of writing, SOL was trading around $108.50. It had surged by over 10% from $97 within 24 hours.
During the same period, its trading volume increased by 25%. This rise highlights greater participation from traders and investors compared to the previous day.
Solana’s technical analysis and upcoming level
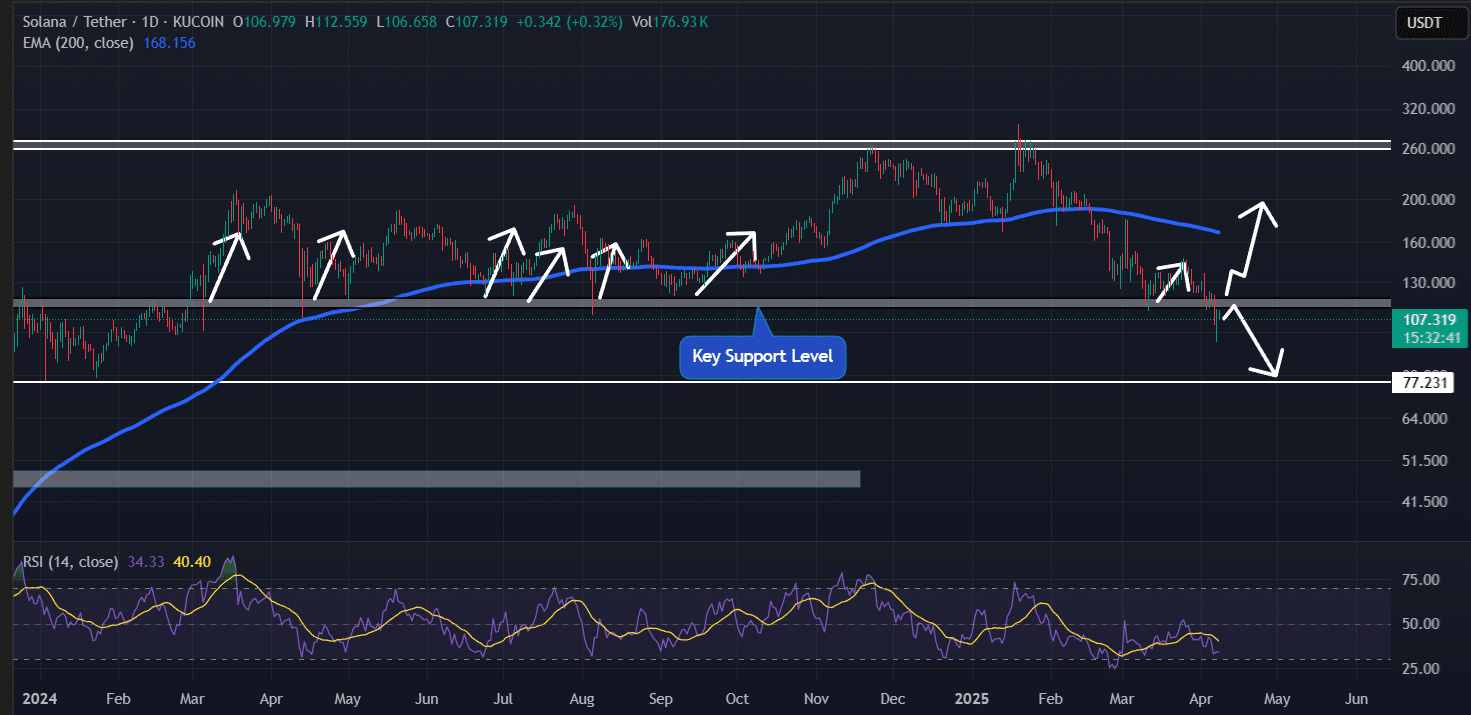
According to AMBCrypto’s technical analysis, on April 6, 2025, SOL broke below its key horizontal support level of $114 for the first time since March 2024.
Historically, this level has acted as a point of price reversal or rebound, but this time, the pattern has failed.

Source: TradingView
Following the breakdown, SOL’s daily candle closing below $114 suggests the asset is likely to continue crashing.
If SOL remains below $114, historical patterns suggest a potential 30% drop. This could lead to the next support level at $77.
At press time, SOL traded below the 200-day Exponential Moving Average (EMA) on the daily chart. This indicates a strong downtrend with continued downward momentum.
In such conditions, traders and investors often seek shorting opportunities.
Other technical indicators, like the Relative Strength Index (RSI), were near oversold levels. This reflects ongoing bearish sentiment and highlights dominant selling pressure in the market.
Bearish on-chain metrics
Given the bearish market sentiment and high volatility of the asset, traders appear to be strongly betting on the bearish side despite recent gains, as reported by the on-chain analytics firm Coinglass.
Also, data from the SOL Long/Short Ratio stood at 0.95, indicating that traders are holding slightly more short positions than long positions in the market, a bearish signal.
Coinglass data further revealed that traders were over-leveraged at $108.50 on the lower side (support), where they have built $23.20 million worth of long positions.
Meanwhile, $113.10 is another over-leveraged level on the upper side (resistance), where they have built $85 million worth of short positions, clearly indicating traders’ bearish outlook.

Source: Coinglass
When combining these on-chain metrics with technical analysis, it appears that bears are currently dominating the asset.
However, these short and long positions are likely to be liquidated once the price moves significantly in either direction.


