- Stellar’s recent price movements have drawn attention due to significant volatility, strong rallies, and sharp pullbacks.
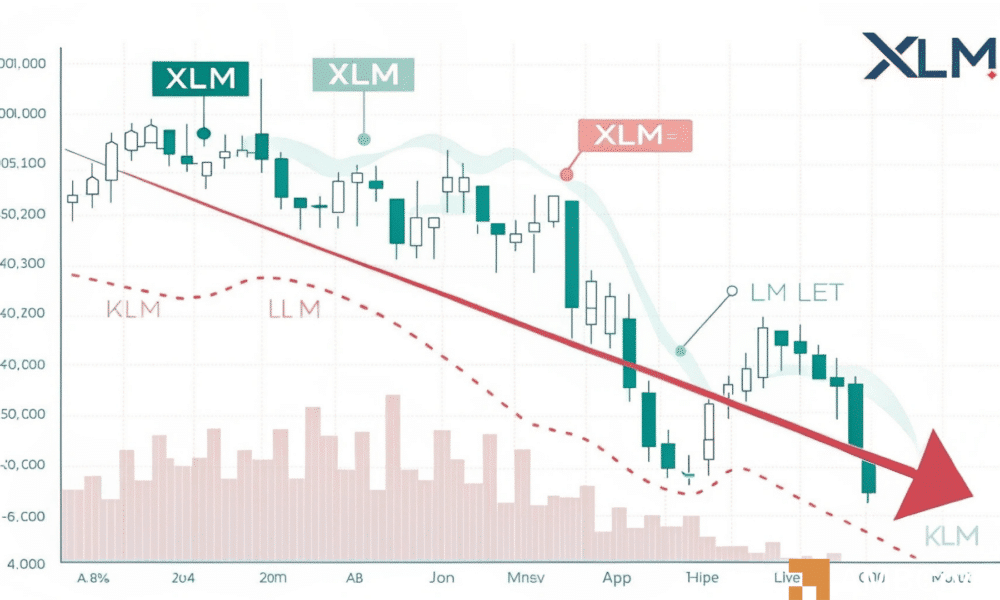
- XLM’s 1-hour chart confirmed a break from the uptrend, with the price dropping from $0.3317 to $0.2855.
Stellar’s [XLM]recent price movements have drawn attention due to significant volatility, strong rallies, and sharp pullbacks.
The sudden surge was followed by a correction, reflecting typical market cycles where traders balance profit-taking against new accumulation.
By analyzing price action, trend shifts, volatility, and market sentiment, traders can assess whether Stellar is poised for another rally or further decline.
XLM/USDT experienced a 24.6% price drop, falling from $0.37963 to $0.2855, after testing a support range of $0.26-$0.27.
The rally leading to this decline was likely driven by FOMO buying, followed by profit-taking.
The 7-period SMA at $0.2985 indicated bearish sentiment as the price dipped below the trendline. Historical trends suggest corrections of over 20% often precede renewed bullish momentum.
If support at $0.26 holds, accumulation may trigger a rebound. However, a break below $0.26 could lead to a further decline toward $0.22.
Signs of a trend reversal and key market signals
XLM’s 1-hour chart confirmed a break from the uptrend, with the price dropping from $0.3317 to $0.2855. The 7-period SMA at $0.2985 reinforced the shift to bearish sentiment.

Source: Coinglass
The Rate of Change (ROC) at -12.13 hinted at a possible short-term recovery. However, the MACD at -0.00347, with a signal line at -0.01278, suggested continued weakness.
If ROC turns positive, the price may test $0.30, similar to prior recoveries. But failure to reclaim $0.2985 could lead to a retest of $0.27.
A bullish MACD crossover may indicate a trend reversal, while prolonged bearish momentum could delay recovery efforts.
Market volatility and its impact on future price action
XLM’s price fluctuations remain significant, with the Volatility Index at $0.29240. Recent swings between $0.37963 and $0.2855 highlighted sharp price movements.

Source: Coinglass
Volatility spiked as buying pressure escalated, but eased as selling intensified. If volatility drops below 0.25, price consolidation near $0.27 may occur, offering stability.
Conversely, a surge above 0.30 could precede another drop to $0.22. Historical patterns suggest that volatility spikes beyond 0.35 often lead to sharp corrections.
XLM: How are traders positioning themselves?
XLM’s Long/Short Ratio provided insight into trader positioning. The Taker Buy/Sell Volume ratio peaked at 1.30, indicating bullish dominance, with 60% long positions versus 40% shorts on March 03, 00:00.

Source: Coinglass
The Long/Short Accounts ratio mirrored this trend, with longs at 55% and shorts at 45%. The imbalance drove the price to $0.37963, but the subsequent correction to $0.2855 suggested profit-taking and short covering.
A drop in the ratio below 1.0 could indicate a growing bearish sentiment, pushing the price toward $0.26. Conversely, a rebound above 1.2 might support recovery toward $0.30.
Historical trends show that sustained long dominance often precedes corrections, making sentiment shifts a key indicator for traders.
In conclusion, XLM’s price movements reflect a market in flux, with recent volatility offering both risks and opportunities. The 24.6% decline tested critical support at $0.26-$0.27, with a break lower potentially leading to $0.22.
Volatility remains high, and sentiment shifts in Long/Short Ratios could dictate the next move.