- Uniswap was approaching a weekly level that has been holding its price action since December 2020.
- The potential reaction from the zone has been backed by the accumulation of Smart Dex traders who have started buying UNI.
The price action of Uniswap [UNI] was approaching a key weekly support level at $3, as of press time. This key support level has held price since December 2020 protecting against a drop below.
UNI has consistently shown a bullish reaction whenever it reaches this price level. Notable examples include recoveries in mid-2022, mid to late 2023, and Q4 of 2024, each occurring after touching this level.
Currently, the MACD indicator signals a bearish trend, with the MACD line at -0.596, the signal line at -0.503, and the histogram at -0.093. Since the MACD line is below the signal line, this suggests the possibility of a further decline, potentially toward the $3 level.

Source: TradingView
If the price reaches the $3 support level and rises while the histogram narrows, this could signal potential bullish convergence. A double-bottom pattern at $3 in late 2024 previously triggered an upward breakout, leading to a bullish trend.
As long as the $3 support remains intact, a move higher can be anticipated based on past reactions at this level. However, a break below $3 would invalidate the support and indicate a shift toward a bearish trend.
Smart Dex traders accumulating UNI
Looking at smart money accumulation for top tokens on Ethereum recently showed UNI registered a buy volume of $64.9K and no sell volume, reflecting a net volume of $64.9K.
The average buy price is $6.5 with the cumulative volume hitting $66.3K. This modest but consistent accumulation by astute money, as Uniswap moves towards a potential bullish reversal point at $3 suggested initial buy interests.
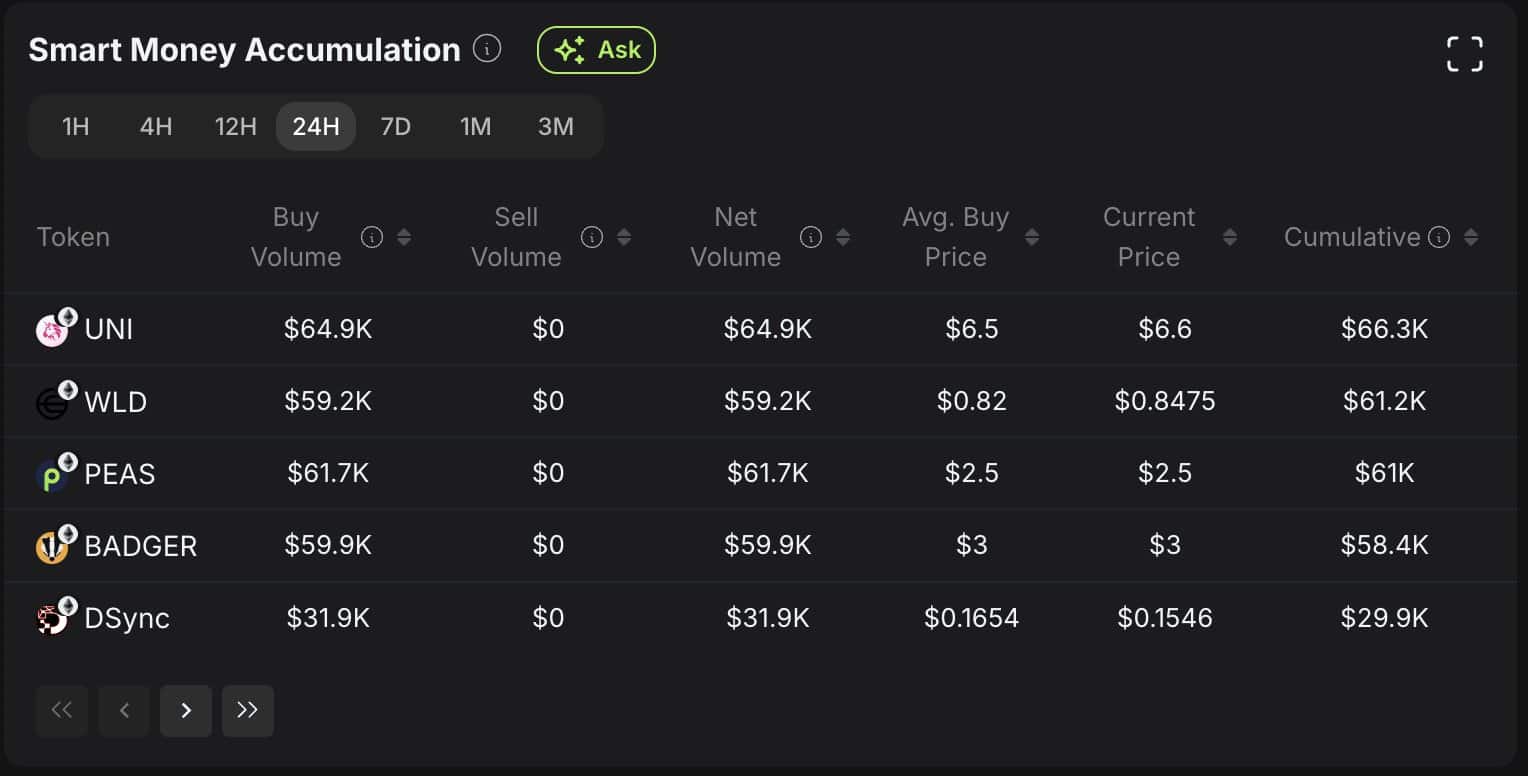
Source: iCryptoAI
The absence of selling volume indicates market confidence and could signal a potential reversal. Other tokens, such as WLD, have also shown signs of accumulation, reflecting overall market optimism.
If this trend continues, UNI may gain upward momentum; however, a lack of consistent buying activity could delay the reversal.
Additionally, ownership data for UNI highlights distinct patterns. Whales lead with a +2.15% 30-day change, indicating accumulation. Meanwhile, investors show a -4.06% change, reflecting profit-taking and retail ownership has increased by +1.71%, showing moderate accumulation.
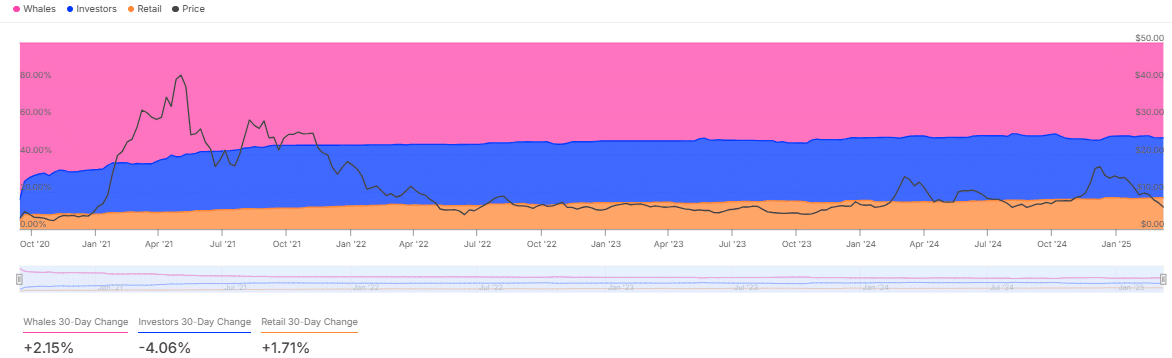
Source: IntoTheBlock
Whale accumulation is a sign of bullish pressure, which can drive UNI prices higher if sustained. Conversely, investor selling could cap gains, risking a drop below $3.
The dynamic shift in ownership, especially whale interest, could significantly influence UNI’s reversal trajectory.