In brief
- Pump.fun’s PUMP token has crashed more than 60% since its launch, following a $600 million iCO.
- The meme coin launchpad’s co-founder has said there’s no airdrop coming any time soon, which only intensified the sell pressure.
- What do the charts say? It’s not looking good.
The crypto market’s risk-on sentiment has done little to save Pump.fun’s native token PUMP, which continues its downward spiral following Pump’s massive ICO just two weeks ago.
The crypto market is holding relatively steady, with Bitcoin near $117,000 and most coins still showing bullish momentum. Pump’s token, though, not so much. After debuting at a $4 billion fully diluted value following the meme coin launchpad’s $600 million token sale, PUMP has now dropped by 63%. The token is currently trading at $0.0024, well below its ICO price, with a $879 million market cap and $2.4 billion FDV.
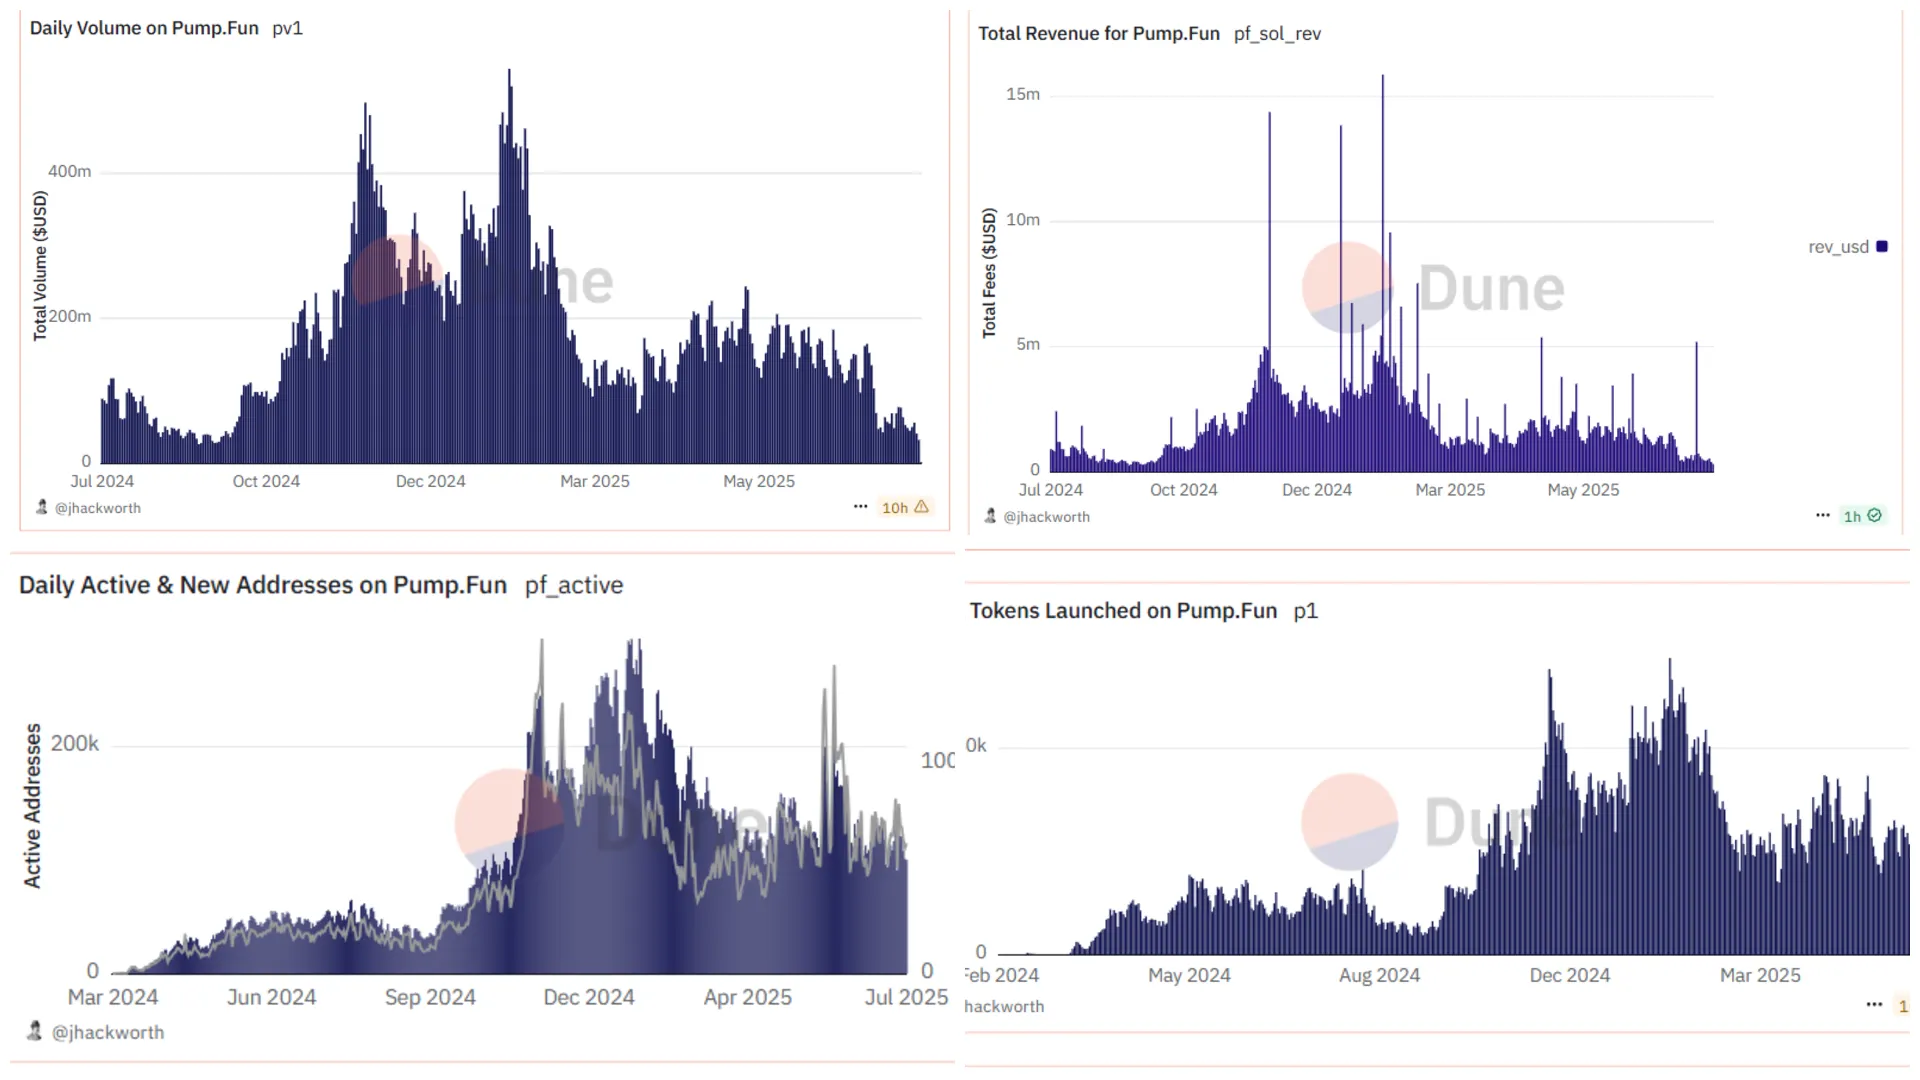
The disconnect between Pump.fun’s success as a business—deploying 12 million tokens and generating over $775 million in revenue—and its token’s disappointing performance has left investors scratching their heads. And racing for the exits.
So what’s going on?
Pump’s broken promises
During a July 24 livestream, Pump.fun co-founder Alon Cohen confirmed that the highly anticipated PUMP airdrop “would not happen in the immediate future,” triggering immediate selling pressure from disappointed investors.
For context, Pump.fun is a token launchpad on Solana that allows for anyone to create their own meme coin in seconds and at no cost. Prior to the launch of the PUMP token, which sold out in an ICO in 12 seconds, speculation was rampant among degens that Pump.fun would airdrop some percentage of the token’s total supply to users of the platform. The company, in fact, confirmed that an airdrop was “coming soon” when it announced the sale of the token.
Now, Cohen has said it’s likely not, and that’s got users in a tiff. The vague responses and lack of concrete timelines has transformed a very hyped event from a very hyped platform into very panicked selling.
Making matters worse, a recent $5.5 billion class-action lawsuit filed in New York alleges Pump.fun operates an unlicensed casino scheme via meme coin trading, with Solana Labs and the Solana Foundation named as co-defendants.
The zero-vesting token model, which initially attracted buyers with promises of immediate liquidity, has backfired spectacularly. Nearly 60% of presale participants have sold or transferred their tokens, according to BitMEX, adding to the relentless sell pressure that has pushed PUMP 60% below its ICO price.
While Pump bleeds out, competitor LetsBonk has been quietly stealing market share, which is also likely playing into this. Even though Pump.fun has growth numbers that rival the biggest players in crypto, its revenue has slowed down considerably as LetsBonk captures more and more of the meme coin trading market.
On a side note, users on Myriad, a prediction market developed by Decrypt‘s parent company Dastan, were once at least willing to entertain the notion that Pump.fun’s PUMP token would surpass the Bonk meme coin in market cap. A week ago, they gave PUMP an 18% chance. Today, those odds are down to just 3.2%.
Despite Cohen mentioning that $20 million worth of PUMP had been repurchased after launch, plus another $550,000 in recent days, it’s seemingly done very little to stem the bleeding.
The launchpad’s declining activity and nearly all of its fundamentals suggest its glory days may be behind it. Daily active users are down 70% from the peak, revenue numbers have fallen throughout the year, and the number of tokens launched has also declined in 2025.
So what about the charts?
PUMP price analysis: Not a bull in sight
Just to catch you up once again: The PUMP token is currently trading at $0.0024. Down 2.50% in one hour, down 15.28% in the last 24 hours, down 41.88% in the last week, and down 63% since July 16—one day after its ICO.
It is the worst performing token in the top 100 coins. And that’s been the case for a few days now.
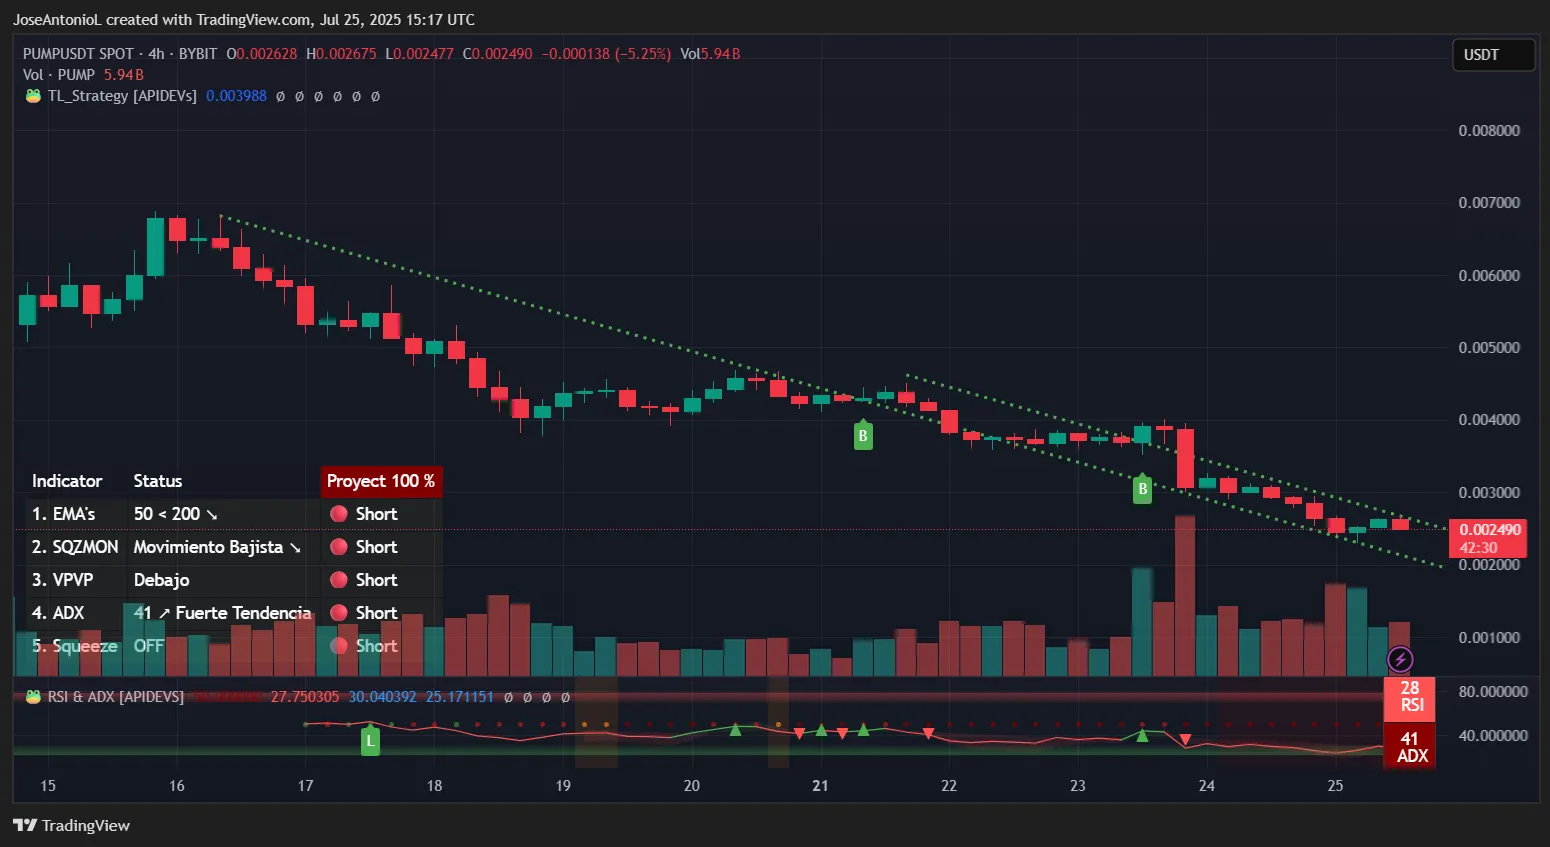
In fairness, the token is far too young to do proper technical analysis on daily candlesticks. But the 4-hour chart paints a grim picture for PUMP holders, with every technical indicator screaming “sell.”
The Relative Strength Index, or RSI, sits deep in oversold territory at 28 points. Typically anything below 30 indicates extreme selling pressure. While oversold conditions often precede bounces, the lack of any bullish divergence suggests sellers remain firmly in control.
Traders typically look for RSI to climb back above 30 as an early sign of stabilization, but PUMP shows no such signals.
The Average Directional Index, or ADX, measures trend strength regardless of direction, with readings above 25 confirming a strong trend and above 40 indicating an extremely powerful move. At 41, PUMP’s ADX confirms this isn’t just a correction after the ICO’s pump but a full-blown downtrend with significant momentum. When ADX is this elevated during a price decline, it typically means the selling pressure has more room to grow before exhaustion.
With PUMP being such a young token, traditional 50-day and 200-day price averages aren’t available. However, the shorter-term averages that exist all slope downward, with each successive average below the previous one—a textbook bearish alignment. So, for traders, it really doesn’t take much to conclude that, right now, any short-term average will register lower prices than a longer trend, since prices have only gone down with no bullish correction.
This configuration acts as dynamic resistance on any bounce attempts, making sustained rallies nearly impossible.
The Squeeze Momentum Indicator is currently “off” on the 4-hour timeframe, indicating that volatility has already been released—probably post ICO. This suggests the explosive move down has played out in the near term, but without any bullish momentum building, it’s easy for traders to interpret this to mean sideways-to-down action is the most likely scenario.
The only glimmer of hope comes for day traders using the 1-hour chart, which is also extremely bearish but shows a zone of bullish impulse at least in the immediate term. Not enough to cancel multi-day losses, but probably good for a few trades with very small windows. We’re talking hours if not minutes.
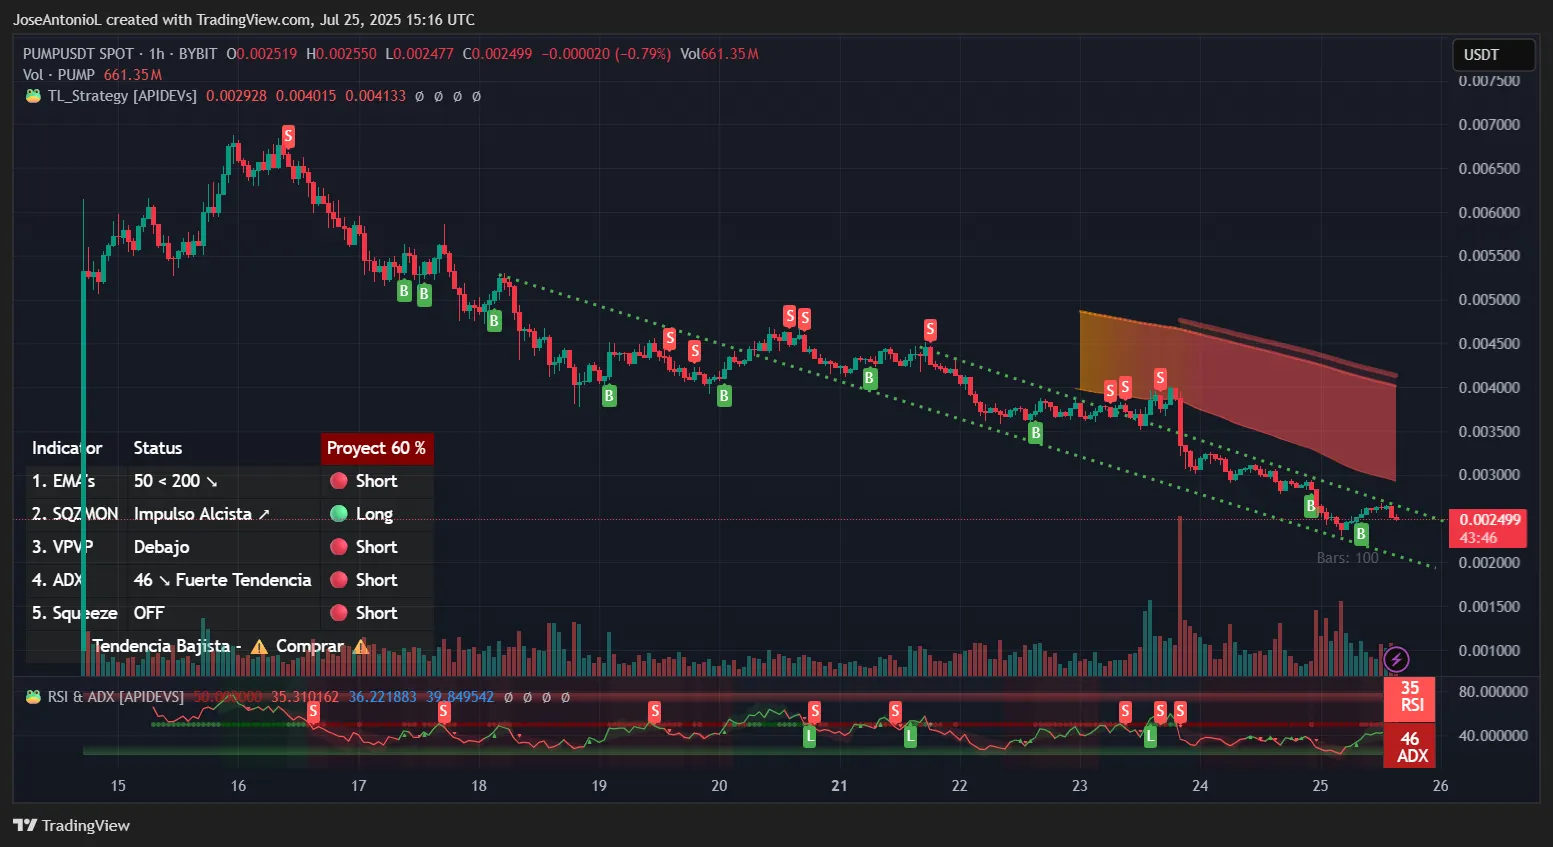
The descending channel pattern visible on the chart provides clear boundaries for the current downtrend. PUMP would need to break above $0.0027 (the upper channel line) to even hint at a trend reversal. Until then, the path of least resistance remains decisively lower. Sorry, PUMP believers, but we don’t make the rules.
Key Levels:
- Immediate support: $0.00239 (psychological level and stop-loss zone)
- Strong support: $0.00200 (round number that could attract bargain hunters)
- Immediate resistance: $0.0028 (pivot point and liquidity zone)
- Strong resistance: $0.00340 (upper boundary and breakout level)
Disclaimer
The views and opinions expressed by the author are for informational purposes only and do not constitute financial, investment, or other advice.
Daily Debrief Newsletter
Start every day with the top news stories right now, plus original features, a podcast, videos and more.