
In brief
- Bitcoin is currently priced at $109K—but traders on Myriad are split on a breakout before July 11.
- Momentum indicators flash warning as sideways action and stiff resistance put bulls on edge.
- Charts are equally inconclusive, especially for such a short timeframe.
Will Bitcoin surge past $109,000 by July 12? With just three and a half days remaining and less than a 1% move required, cryptocurrency traders are placing their bets on whether the world’s largest digital asset can overcome critical resistance levels that have capped recent rallies.
Currently trading around $109,090, Bitcoin sits very, very close to the $109,000 threshold—just $90 on top of that thin red line depending on exact market pricing.
Myriad, a prediction market developed by Decrypt’s parent company Dastan, the question “Bitcoin price above $109,000 on July 11?” shows a small shift in the odds, with traders changing their minds throughout the week. It’s now currently in the 50-50 zone.
What makes this prediction particularly intriguing is the razor-thin margin for error. Unlike broader monthly targets, this market requires Bitcoin to be trading above $109,000 at a specific moment—11:59pm UTC on July 11—making it a pure test of Bitcoin’s ability to break through immediate resistance levels.
Bitcoin price: What the charts say
Given the short timeframe, we are using four-hour and one-hour candlesticks on the charts for the following analysis. In the four-hour timeframe, prices are currently following a triangle pattern with supports and resistances converging well past the target date. The coordinates for the price and time end up over the triangle, meaning, Bitcoin would need to break this phase and enter into a bullish confirmation to meet the market resolution criteria for “Yes.”
If it fails and stays within the current pattern, it will close the day below the target. Symmetrical triangles are usually bullish, it’s just that the breakout moment would need to be anticipated in this case, which is not uncommon.
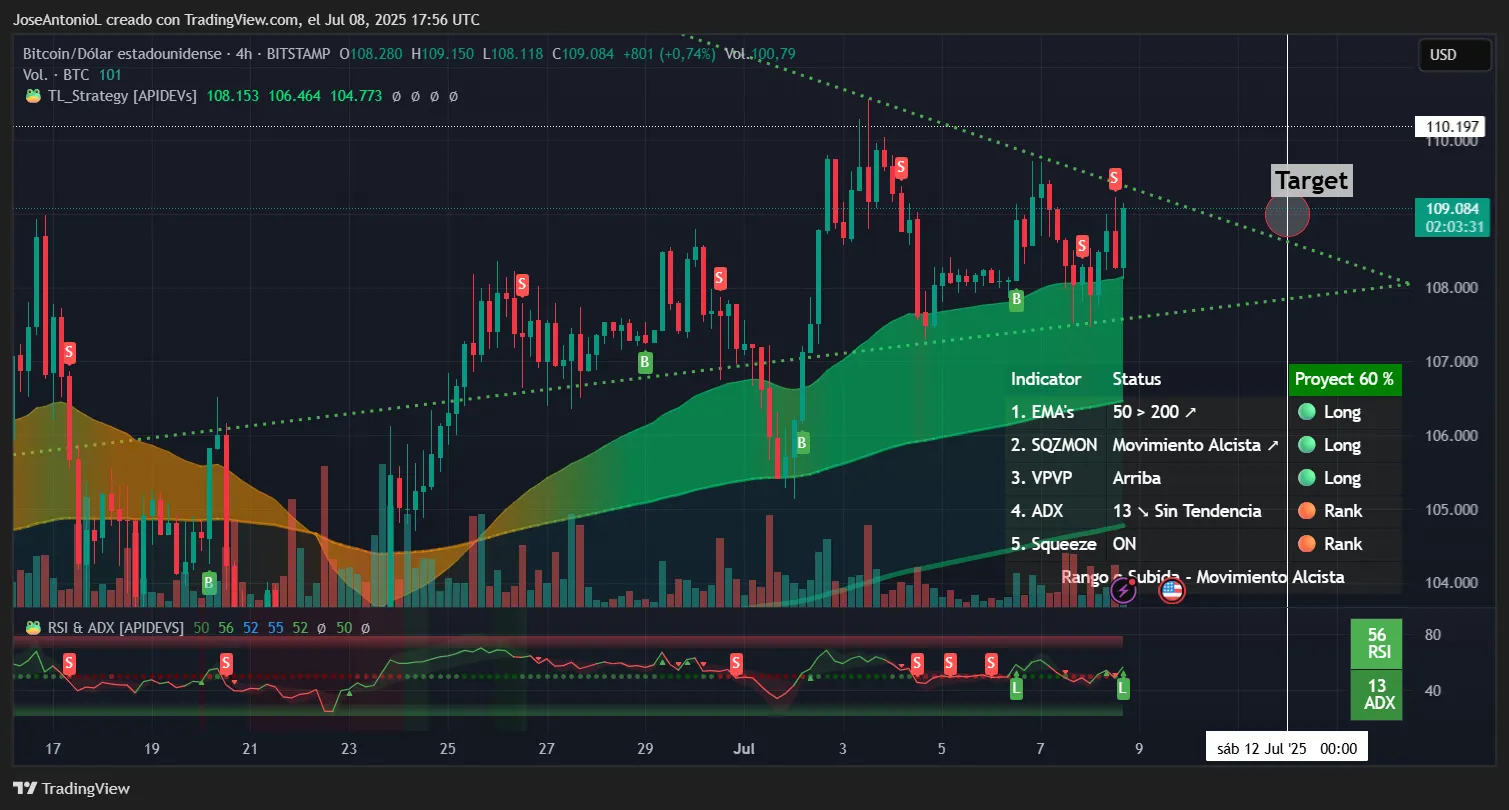
The technical picture shows a battle between bullish market structure and bearish momentum indicators. On the four-hour timeframe, Bitcoin maintains a healthy uptrend structure with its 50-day exponential moving average, or EMA, sitting comfortably above the 200-day EMA—traditionally a bullish signal that suggests the overall trend remains upward. (An EMA is simply the average price of an asset over a given period of time.) But this optimistic backdrop is tempered by momentum indicators that tell a different story.
The Squeeze momentum indicator, which tracks market momentum, is flashing bullish signals on both the four-hour and one-hour charts after a recovery from a small dip earlier in the day.
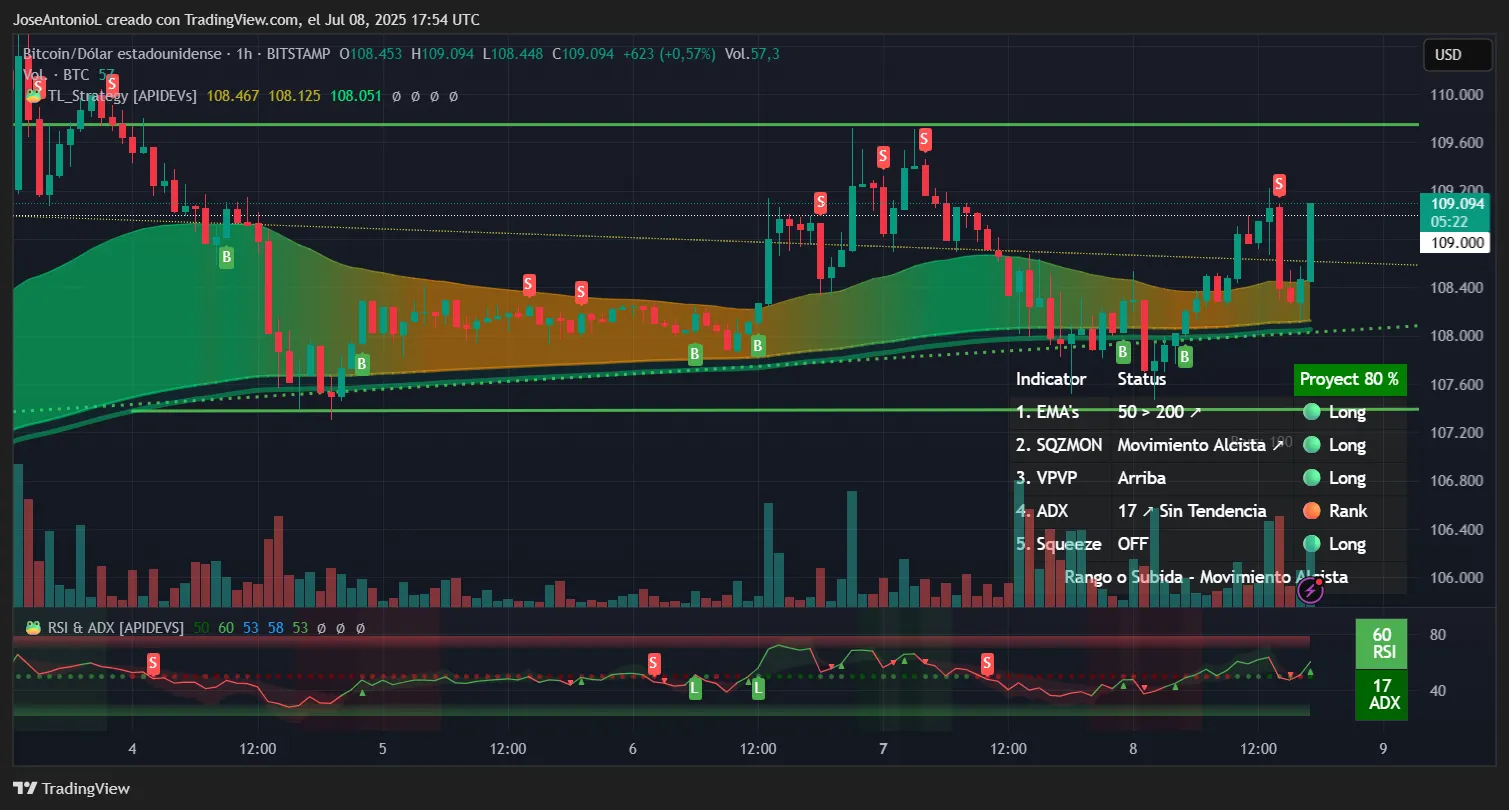
On the other hand, the Average Directional Index, or ADX, reads just 13 on the four-hour chart and 17 on the one-hour chart—both well below the 25 threshold that typically indicates a strong trending market. In simpler terms, while Bitcoin’s price structure looks healthy, the market lacks the conviction and directional strength typically seen during decisive moves.
Perhaps most intriguing is the Squeeze indicator’s behavior across timeframes. On the four-hour chart, it shows “on,” indicating a period of price consolidation—basically what the symmetrical triangle shows. However, the one-hour chart tells a different story with the Squeeze off under bullish impulse. This divergence often precedes sharp directional moves, though predicting the direction requires careful analysis of other factors.
Fast-paced markets usually have more noise and volatility. However, the changes in trends usually appear first on these charts before they can be confirmed on longer-term sessions
Bitcoin is bullish, but is it bullish enough?
When Bitcoin is losing steam, making short-term predictions is difficult. Based solely on the charts, the probability of Bitcoin closing above $109,000 by the July 11 deadline appears to be moderately low—essentially a coin flip with a slight bearish tilt.
With Bitcoin trading sideways, most indicators echo this uncertainty. Assuming the 200-EMA continues to act as support through July 12, the target price will end up sitting about halfway between the $109,000 target and overhead channel resistance.
The four-hour pattern skews more bearish. If the current corrective phase persists and Bitcoin remains inside the triangle, prices could end below the target zone before spiking up to confirm a bullish trend.
Weak ADX values point to a lack of conviction, often a precursor to failed breakouts. Compounding this challenge is the confluence of resistance just overhead: the descending trendline, the psychological $109,000 level, and horizontal resistance at $109,717—all forming a formidable barrier.
Absent clear accumulation above $109,000, the odds of a bullish close diminish with each passing hour. The last-hour recovery to this level pushes some bearish mood away, but still not enough to have comfortable confidence to call it a trend.
Beyond the charts, it is wise—especially in this case—to monitor fundamental catalysts that could sway sentiment. Renewed tariff rhetoric from Trump, a weakening dollar index, and a rotation out of high-beta assets into safer havens could all leave Bitcoin more vulnerable to sharp downside moves.
Disclaimer
The views and opinions expressed by the author are for informational purposes only and do not constitute financial, investment, or other advice.
Daily Debrief Newsletter
Start every day with the top news stories right now, plus original features, a podcast, videos and more.