- AAVE’s Exchange Netflow surged by +583.2% in three months, thanks to increased investor deposits.
- AAVE’s Open Interest climbed from 270K to 282K coins, highlighting increased speculative activity.
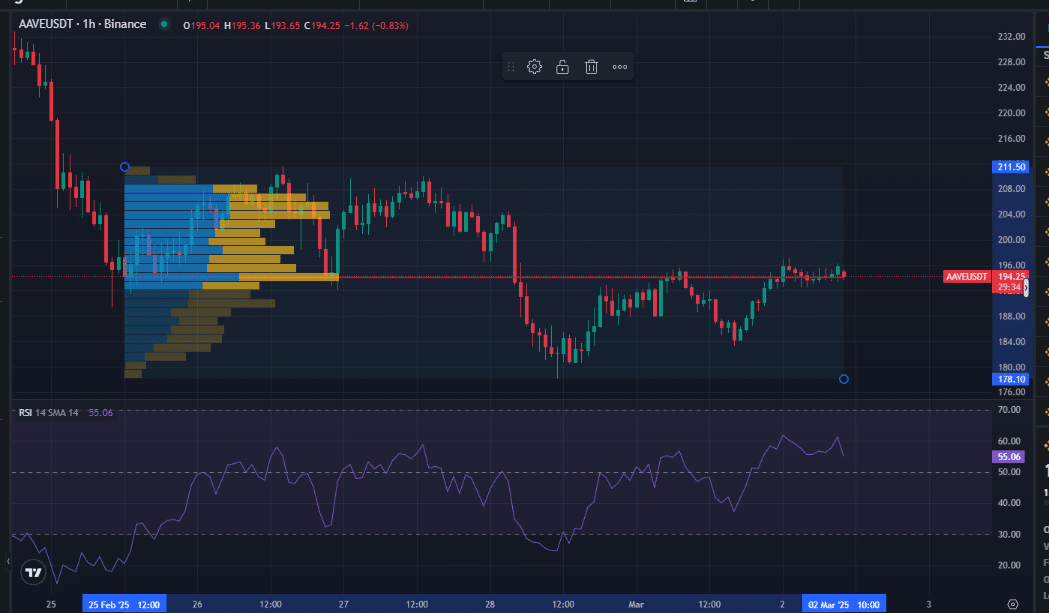
AAVE [AAVE] showed signs of a potential breakout following a consolidation phase, as seen on Binance’s 1-hour price chart. The price declined from $199.36 to $194.25, marking a 0.83% drop.
Volume Profile data indicated strong support at $196.00, with notable activity suggesting price acceptance. The latest candle tested the $194.25 support zone, reinforcing its significance.
Source: Coinglass
Alternatively, the RSI stood at 55.06 on the 14 SMA, indicating neutral momentum. A drop below 50 could signal bearish pressure, while a breakout above $199.36 might propel AAVE toward $210.00 resistance.
However, failure to hold $194.25 could push the price to $188.00, mirroring previous consolidations.
AAVE investor activity and its impact
Further, AAVE’s Exchange Netflow surged by +583.2% in three months, as data from December 2024 to March 2025 revealed increased investor deposits.
Netflows peaked at +98.78K AAVE, indicating heightened accumulation. The 7-day netflow shift showed +4.54K AAVE, while the 30-day change reached +40.4K AAVE.
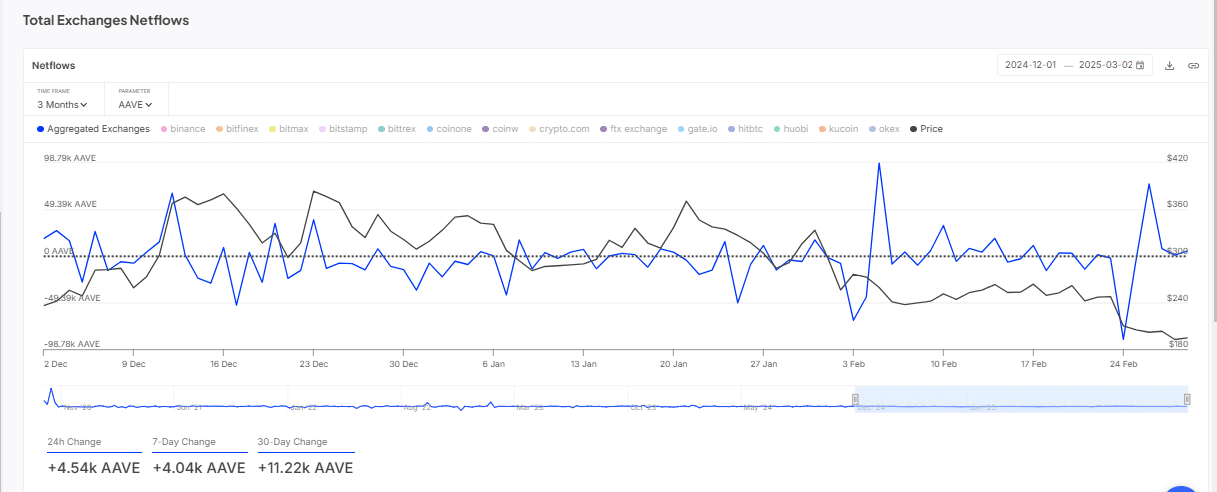
Source: IntoTheBlock
This surge suggested growing investor confidence, potentially fueling an upward price movement. If netflow continues to rise, AAVE could test $220.00 resistance.
Conversely, a reversal below -49.38K AAVE might drive prices to $188.00 support. This pattern resembled early February netflow trends, where similar spikes led to price movements in both directions.
Speculative interest rises as market volatility increases
AAVE’s Open Interest climbed from 270K to 282K coins, highlighting increased speculative activity. A sharp rise to 282K followed by a slight drop to 277.39K reflected market volatility.
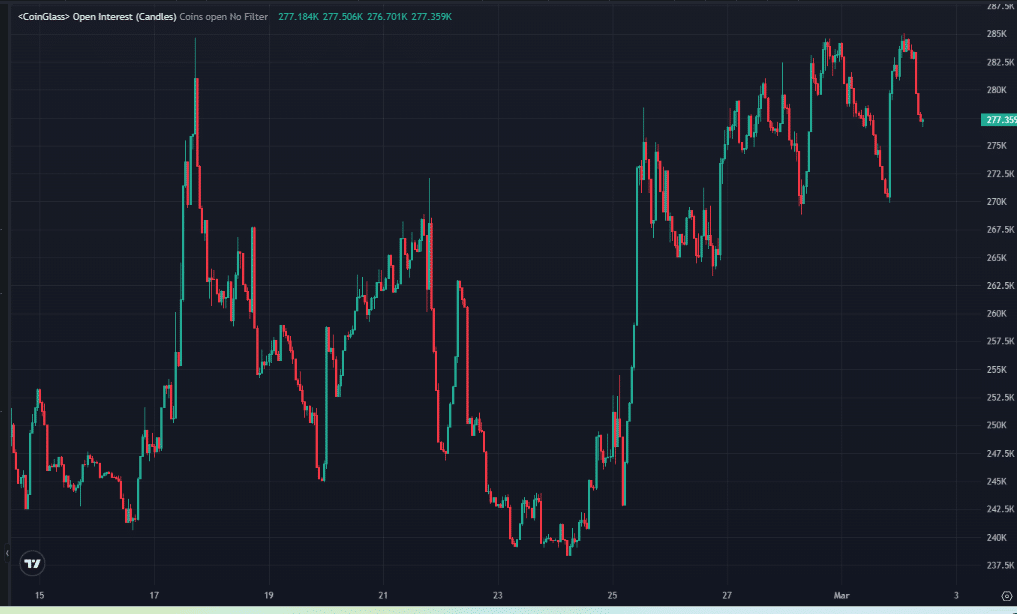
Source: Coinglass
Rising Open Interest often signals bullish sentiment, suggesting potential upward momentum toward the $210.00 resistance level.
If Open Interest declines below 270K, traders might anticipate a sell-off, pushing AAVE toward the $188.00 support zone.
Are bulls or bears in control?
AAVE’s Long/Short Ratio on Binance revealed shifting market sentiment. The Taker Buy/Sell Volume ratio fluctuated between 0.77 and 1.25, with long positions dominating at 60% while shorts held 40%.
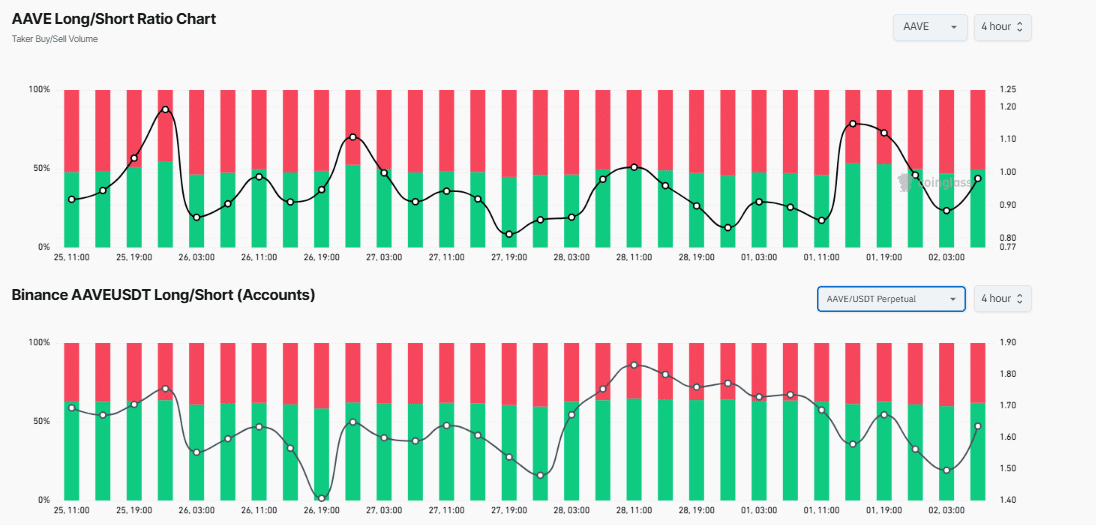
Source: Coinglass
The Accounts Long/Short ratio followed a similar trend, with long positions peaking at 55% and shorts at 45%. This imbalance suggested strong bullish momentum, supporting a potential rally past $199.36.
If short positions exceed 60%, selling pressure could intensify, potentially driving AAVE toward $188.00 support.
In conclusion, AAVE’s market indicators pointed to a pivotal moment, with signs of potential bullish momentum or a further decline.
Price action highlighted key levels at $199.36 resistance and $194.25 support, while Exchange Netflow’s significant rise suggested investor confidence.