In brief
- Bitcoin Cash surged 15% this week to breach $500, marking its strongest performance of 2025 as social sentiment reaches yearly highs.
- Bitcoin SV also rose this week, suggesting that prominent BTC forks are gaining steam as Bitcoin remains flat or slightly down.
- Bitcoin is down slightly around $103,000 as the Fed maintains rates at 4.25-4.5%, while escalating Middle East tensions push oil towards $80.
Here’s something you don’t see every day: Bitcoin’s lesser-known cousins are stealing the show while the king of crypto takes a nap.
Bitcoin Cash has gone absolutely ballistic, rocketing 98% since its low point in April and trying to break the $500 resistance mark for good. Meanwhile, Bitcoin SV—yes, that controversial fork led by Satoshi pretender Craig Wright—is quietly climbing.
This rotation reflects broader market dynamics, with the S&P 500 on Friday hitting 6,000 points for the first time since February, while the tech-heavy Nasdaq approaches its own record near 20,000 as short-term traders appear to have priced in the panic over the current geopolitical events.
The Federal Reserve’s decision to keep interest rates steady at 4.25%-4.5% on Wednesday has created a wait-and-see environment, with policymakers noting that “uncertainty about the economic outlook has diminished, but remains elevated.”
Meanwhile, oil prices climbed over 4% on Tuesday as the Iran-Israel conflict raged, with Brent crude settling at $76.45—a development that traditionally correlates with crypto volatility, but has yet to significantly impact digital asset prices in the days since.
Bitcoin (BTC) in consolidation zone

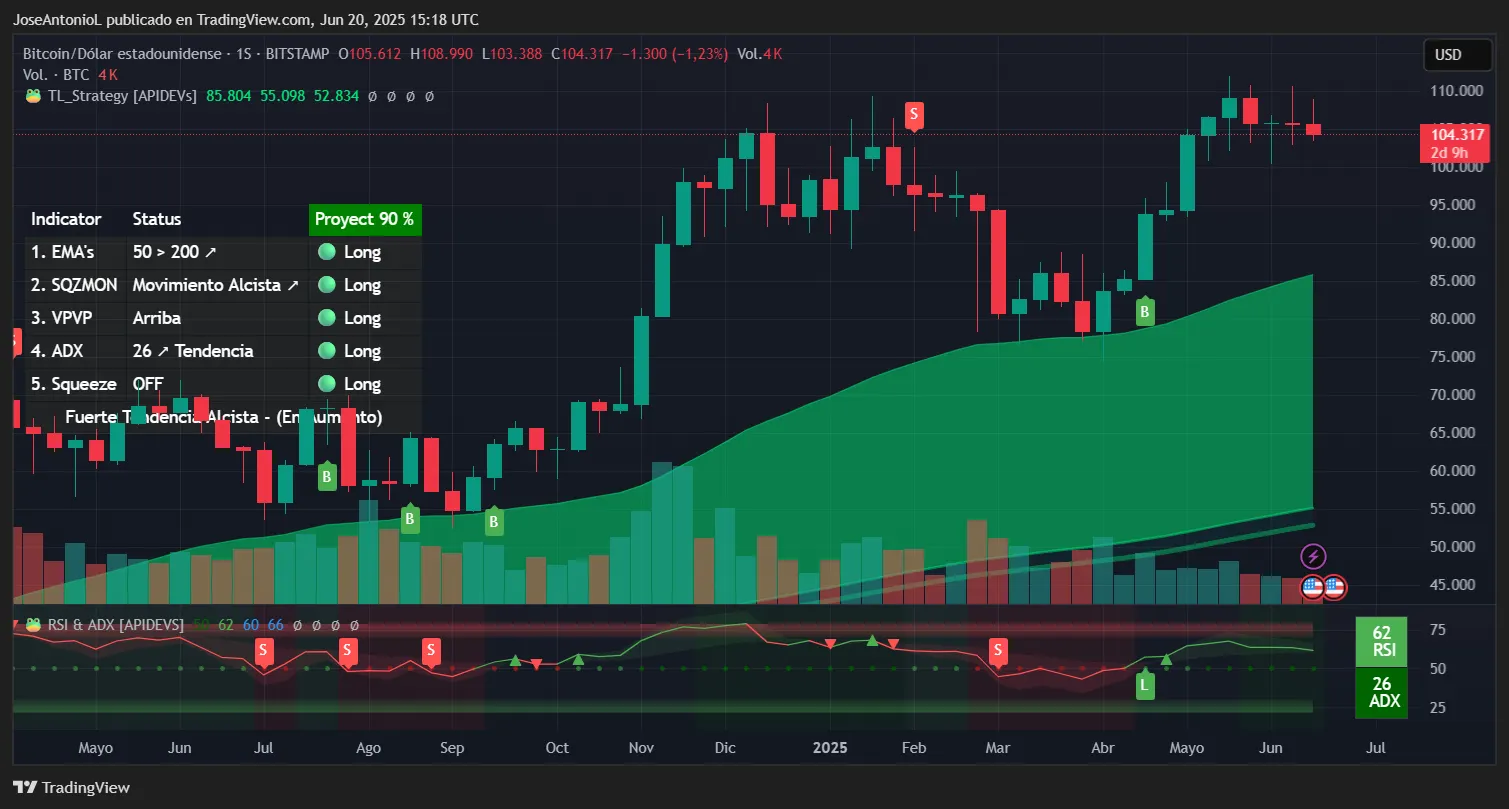
Bitcoin is putting investors to sleep with a 2% to $103,154 over the last week. The flagship cryptocurrency has entered a critical consolidation phase after failing to reclaim the $108,000-$109,000 resistance zone.
For traders watching the tape, this sideways grind often comes before the fireworks—for good or bad.
The weekly chart reveals a market in equilibrium, with several key indicators painting a nuanced picture:
RSI (Relative Strength Index): At 62 on the weekly time frame, Bitcoin shows mild bullish momentum without approaching overbought territory. The RSI measures the speed and magnitude of price changes: readings above 70 typically indicate overbought conditions where traders might expect a pullback, while below 30 suggests oversold levels that could precede a bounce. Bitcoin’s current reading indicates healthy bullish momentum that could support further upside.
ADX (Average Directional Index): Reading 26, the ADX has just crossed the crucial 25 threshold, suggesting a trend is beginning to form in longer time frames. This indicator measures trend strength regardless of direction: below 20 indicates no trend, 20-25 shows a developing trend, and above 25 confirms trend establishment. For momentum traders, this crossing above 25 could signal the start of a more decisive move.
Exponential Moving Averages (EMAs): Bitcoin currently trades above its 50-week EMA (the average price of the last 50 weeks—basically one year), but faces resistance from the convergence of multiple time frames. The 50-200 EMA spread remains positive, which technical analysts often interpret as a bullish market structure. When shorter-term averages stay above longer-term ones, it typically indicates sustained buying pressure.
Squeeze Momentum Indicator: The “off” status on the weekly chart suggests volatility has already been released, contradicting the daily chart’s compression. This divergence between time frames often precedes significant moves as different trader cohorts position themselves.
Key Levels:
- Immediate support: $102,000 (recent institutional accumulation zone)
- Strong support: $100,000 (psychological level and options strike concentration)
- Immediate resistance: $107,000 (recent rejection point and sell wall)
- Strong resistance: $110,000 (approach to all-time high territory)
Bitcoin Cash (BCH) gains momentum

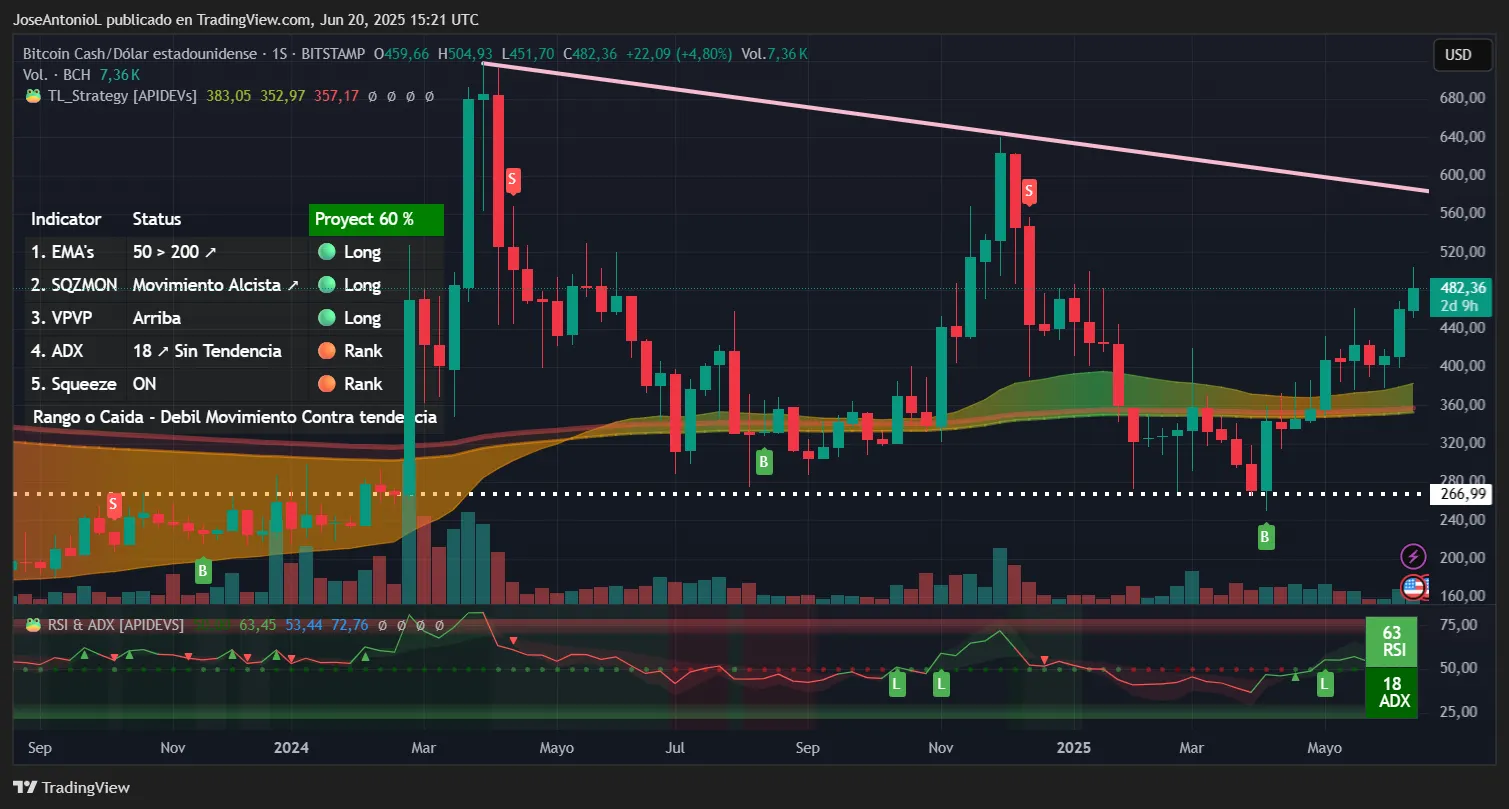
Bitcoin Cash is the week’s star performer with a commanding 14.57% surge to $483, briefly breaking past the psychologically significant $500 level—but it’s been unable to maintain momentum. BCH social media mentions surged as the price began to recover, pushing it to a new peak for 2025.
The weekly chart presents a compelling bullish case with room for continuation, with some cautions needed, of course:
RSI at 63: This reading places BCH in what traders often call the “power zone” —strong enough to indicate genuine momentum, but not yet extended enough to trigger profit-taking. Historical analysis shows BCH tends to run until RSI reaches 75-80, suggesting approximately 20% additional upside potential before overbought conditions emerge. That would match the resistance of the current triangle that has been in place since April.
ADX at 18: While below the 25 trend confirmation level, this reading shows that markets are fighting to push prices forward. However, this might not be a bad signal, and interpretation will vary as the indicator is analyzed alongside other readings. Low ADX readings after a strong move often indicate consolidation before the next leg higher. Traders might interpret this as the market digesting gains before attempting the next resistance level.
Moving Average Configuration: BCH trades decisively above both its 50-week and 200-week EMAs, with increasing separation between them. This expanding gap, known as moving average divergence, typically indicates strong trending conditions. The 50-week EMA near $385 now serves as dynamic support, while the 200-week mark at $352 provides a floor for any deeper corrections.
Key Levels:
- Immediate support: $460 (old resistance often becomes support)
- Strong support: $388 (50-week EMA zone)
- Immediate resistance: $500 (psychological barrier tested this week)
- Strong resistance: $540 (technical target from measured move)
Bitcoin SV (BSV) bounces, but bears show strength

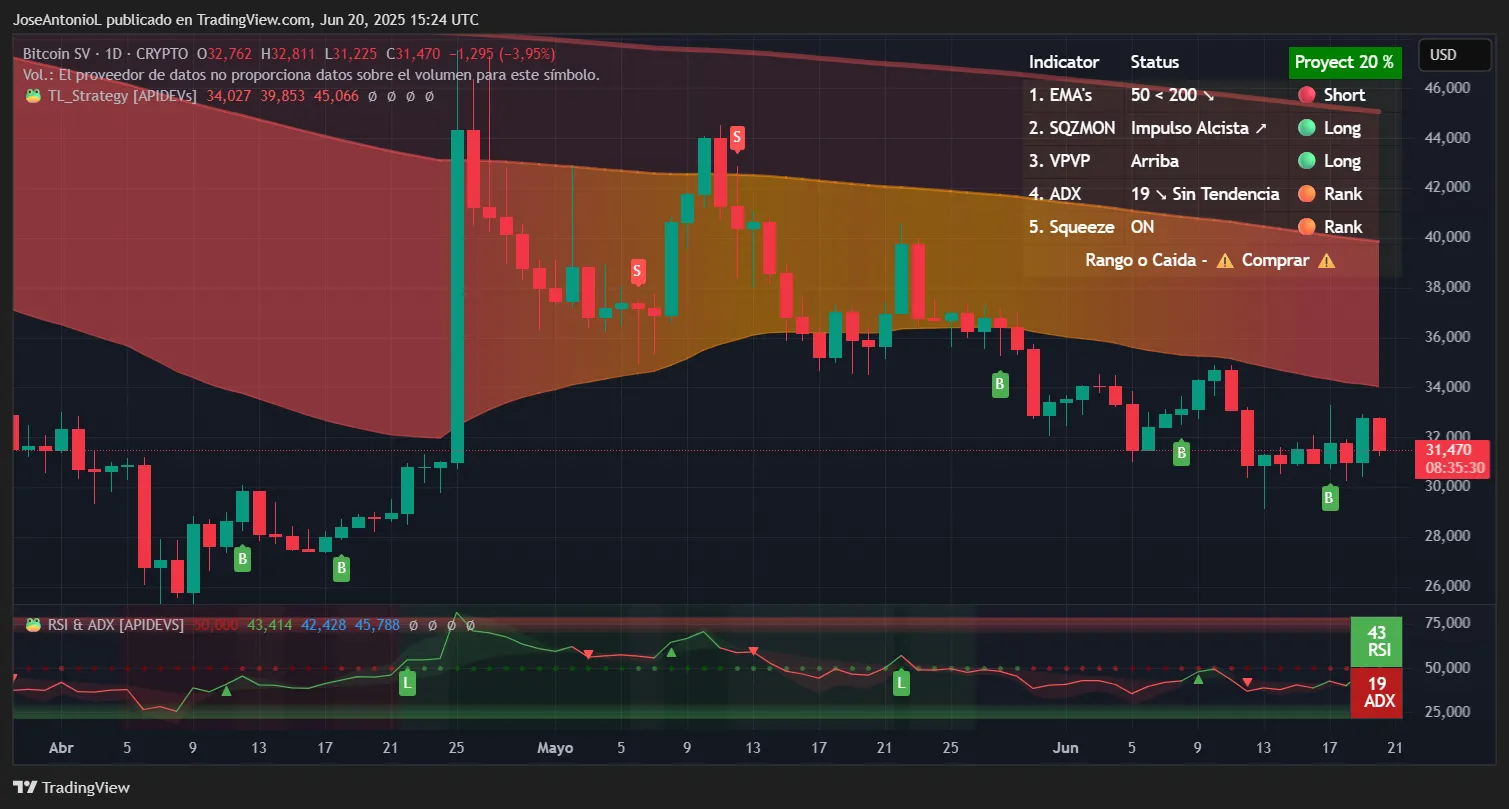
BSV’s 6% weekly gain to $31.47 since last Friday’s low might look like small potatoes next to BCH’s moonshot, but context is everything. The controversial fork is now trading 30% above its June lows despite persistent skepticism, finishing the week as the seventh-best performing cryptocurrency among the top 100. However, today’s correction is giving signs of a flat performance if the week’s shadows are not considered.
BSV’s chart is like reading tea leaves, but here’s what technical traders are seeing.
The RSI at 43 is slightly bearish but not terrible. Think of it as a car running on fumes, but not quite empty. Some contrarian traders love buying when RSI is this low, as they’re betting on a bounce. History shows BSV often bottoms between 35-40, so we’re in the danger zone where brave souls start nibbling.
Also, the ADX at 19 is yet another weak trend reading that creates a coiled spring scenario. When ADX readings remain below 20 for extended periods, the eventual breakout (in either direction) tends to be violent. Range traders might play the boundaries, while trend followers await confirmation above 25.
As for the price averages, BSV keeps failing to break past the 50-day average around $34.87, showing that bears are still pretty much in control of prices in longer time trends.
Key Levels:
- Immediate support: $30 (psychological level and recent consolidation low)
- Strong support: $24-$27 (resistances tested during April)
- Immediate resistance: $34.87 (technical confluence and trend decider)
- Strong resistance: $40.00 (major psychological level and 2025 high)
Edited by Andrew Hayward
Daily Debrief Newsletter
Start every day with the top news stories right now, plus original features, a podcast, videos and more.


