
- Curve DAO token was a long way away from the 2021–2022 highs despite its strong performance in November.
- The short-term momentum was bullish and a 12% price move higher was expected at press time.
Curve [CRV] has gained just over 19% in a week. The bulls were aiming to challenge the $0.55 resistance in the coming days. However, the DeFi token has erased most of the gains it made in November and December 2024.
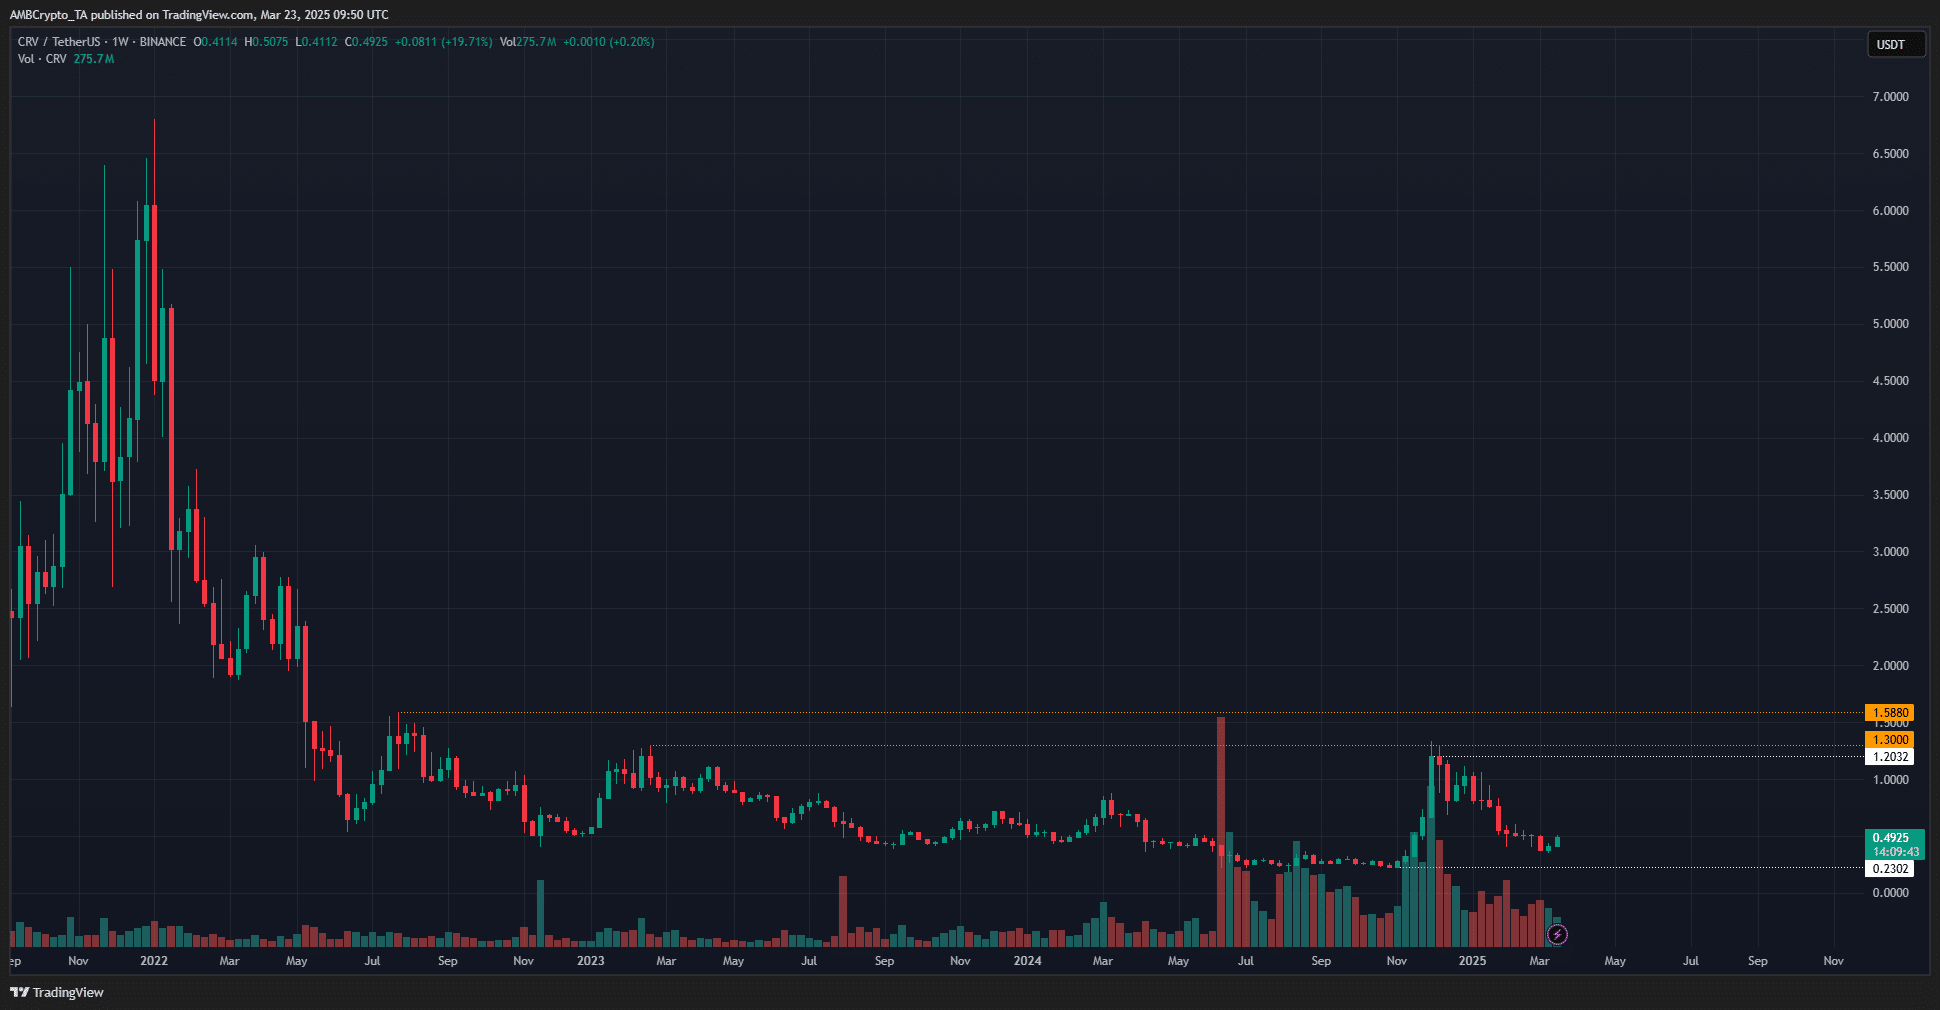
Source: CRV/USDT on TradingView
The weekly chart showed that even though Curve made strong gains in November, the long-term downtrend was not completely overthrown.
Yes, there was a bullish structure break on the weekly chart. This was a sign of strength for the investors.
It might be too little, too late, though. In a bull run, the strong, early runners are usually the ones that sustain their gains throughout the cycle.
Bitcoin [BTC] faced weakness in December and fell below $92k in February, and CRV has followed suit even more aggressively to the downside. This dented the sentiment behind CRV.
Reduced selling pressure meant Curve had a chance of recovery
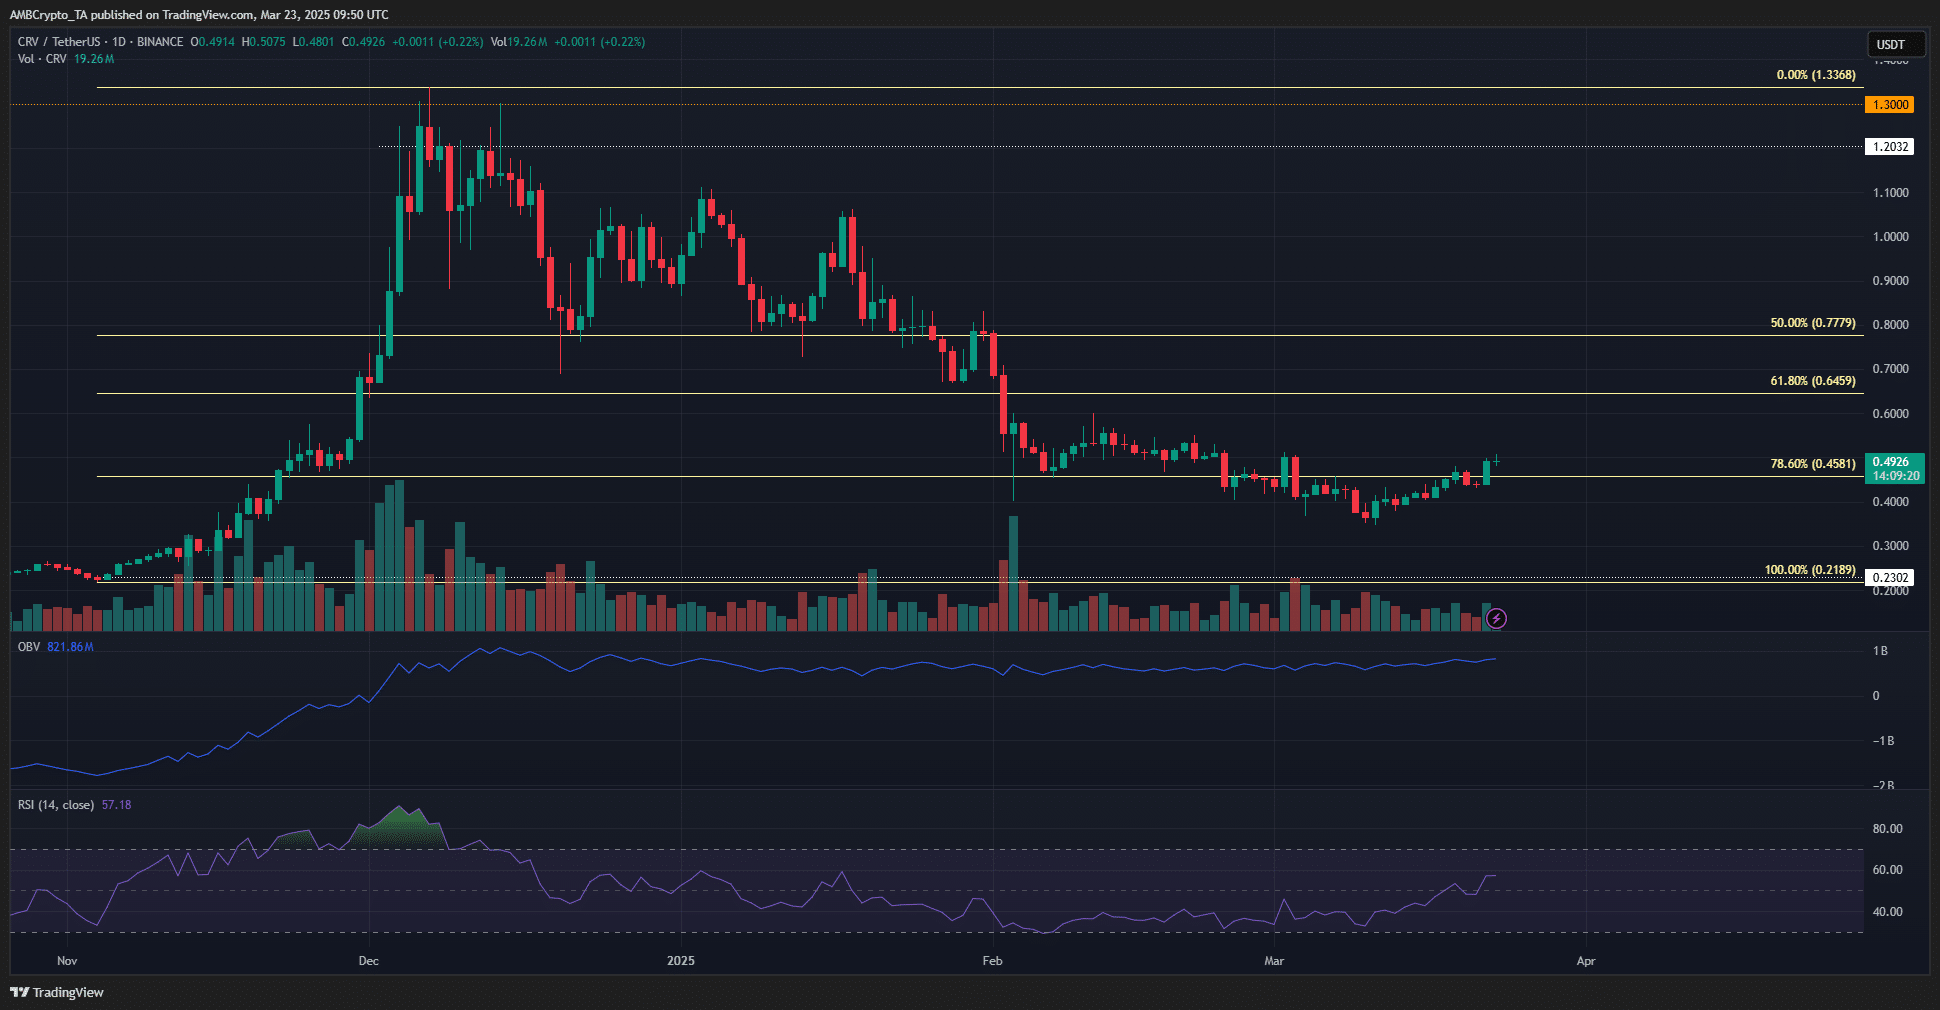
Source: CRV/USDT on TradingView
Zooming into the 1-day chart, we can see that the OBV has not fallen much compared to its December levels. It has even made higher lows in the past three months.
The slow push upward was a sign of a lack of selling volume during the deep retracement. This meant a recovery could come about quickly.
Despite the OBV’s positive sign, the bulls have a lot of work ahead. The RSI has climbed above neutral 50 to signal a bullish momentum shift. Yet, the $0.55 local resistance was still in the bulls’ way.
The daily market structure was bearish, and a breach of $0.55 would change this.
Further higher, the Fibonacci retracement levels would be the key resistances to overcome. BTC’s trends in the coming weeks could have a big influence on CRV’s performance.
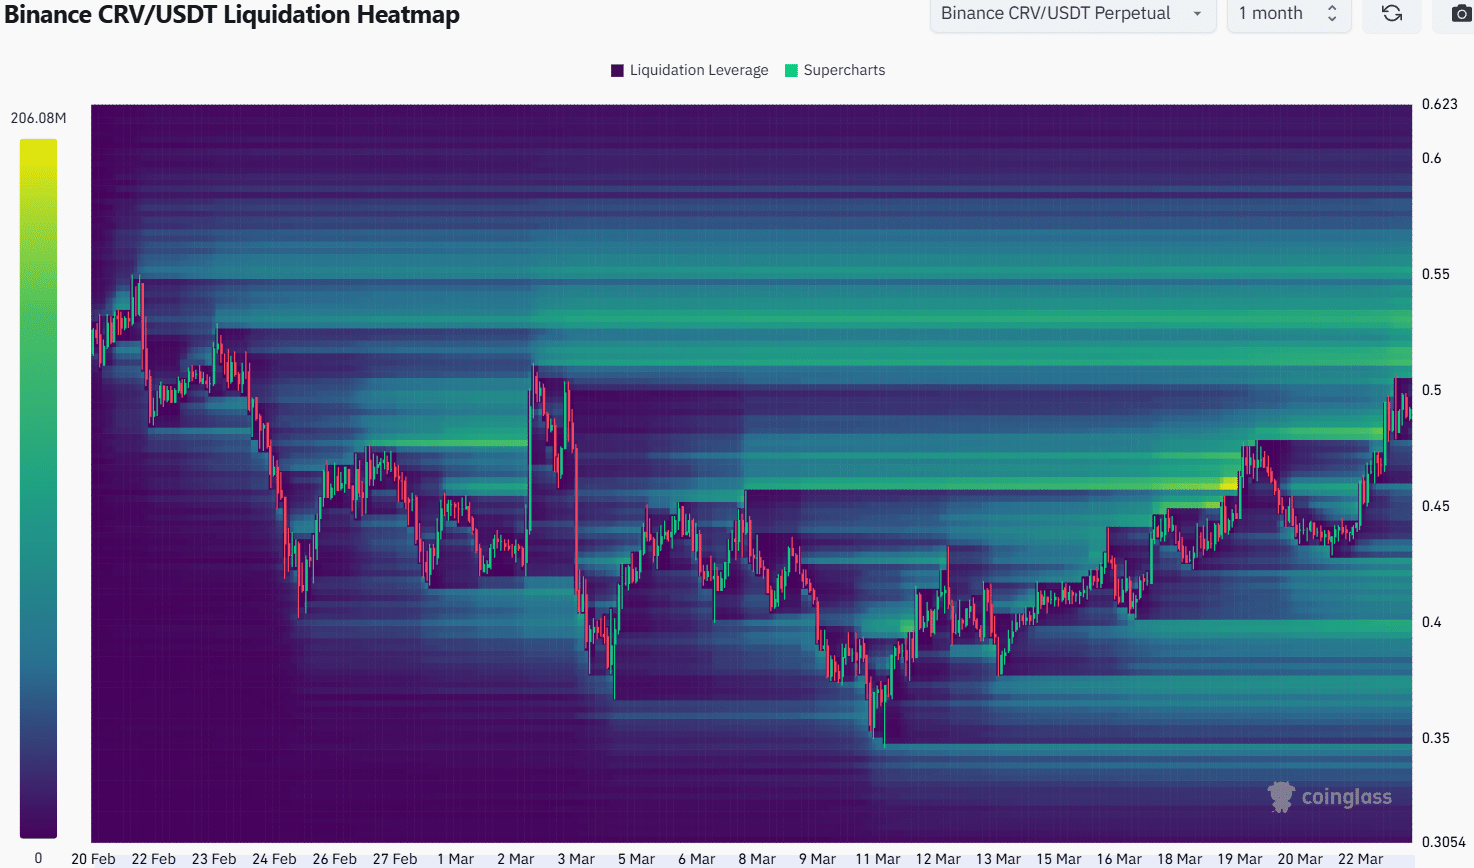
The 1-month liquidation heatmap showed that the area from $0.5-$0.55 was filled with liquidation levels. They could attract Curve prices higher in the coming days.
It was likely that a move to $0.55 would be followed by a minor retracement.
The shorter-period liquidation heatmaps would be worth monitoring to understand how deep such a dip could go. Based on the evidence at hand, a move to $0.55 would likely be followed by a dip toward $0.47.
If the buying volume surges higher, a breakout beyond $0.55 would become more likely, and a pullback to $0.47 would be less likely.
Disclaimer: The information presented does not constitute financial, investment, trading, or other types of advice and is solely the writer’s opinion