
![]()
![]()
Journalist
Posted:
- DOGE whale activity has remained flat this past week, with no major buying or selling pressure.
- DOGE squeezed within a symmetrical triangle as the RSI and PMO indicate a potential surge on the horizon.
Dogecoin’s [DOGE] whale activity stagnated, maintaining a 24.35 billion DOGE average, indicating a lack of significant buying or selling pressure from major holders over the past week.
This suggests a wait-and-see approach among major players.
During this period, the price of DOGE fluctuated slightly, dipping as low as approximately $0.255 and peaking at around $0.288, reflecting minimal market volatility.
The flat activity presents various scenarios for the future of DOGE. On one hand, this could indeed be “the calm before the storm,” where whales are silently accumulating before making a more significant move, potentially driving DOGE up if a buying spree ensues.
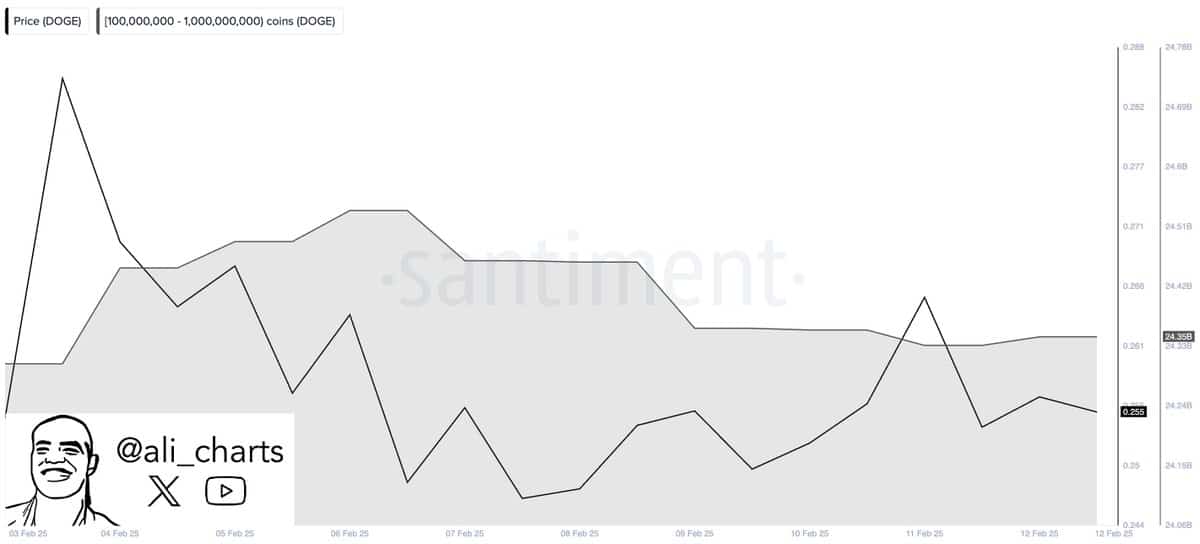
Source: Ali/X
Conversely, the flat activity might indicate diminishing interest among large holders. These holders could be maintaining their positions or slowly exiting, possibly anticipating a continued decline.
The lack of aggressive movements by whales could lead to a sudden price change if external market factors come into play, or if collective whale actions eventually lean towards either mass buying or selling.
What lies ahead for DOGE’s price action?
Analyzing the current price behavior of Dogecoin on a 4-hour chart reveals a squeeze within a symmetrical triangle pattern. This pattern often indicates a consolidation phase preceding a significant price breakout.
The key resistance and support levels are converging, indicating that volatility is likely to increase as the price approaches the apex of the triangle. The RSI supports this view, showing an uptrend within the neutral zone, pointing towards increasing bullish momentum.
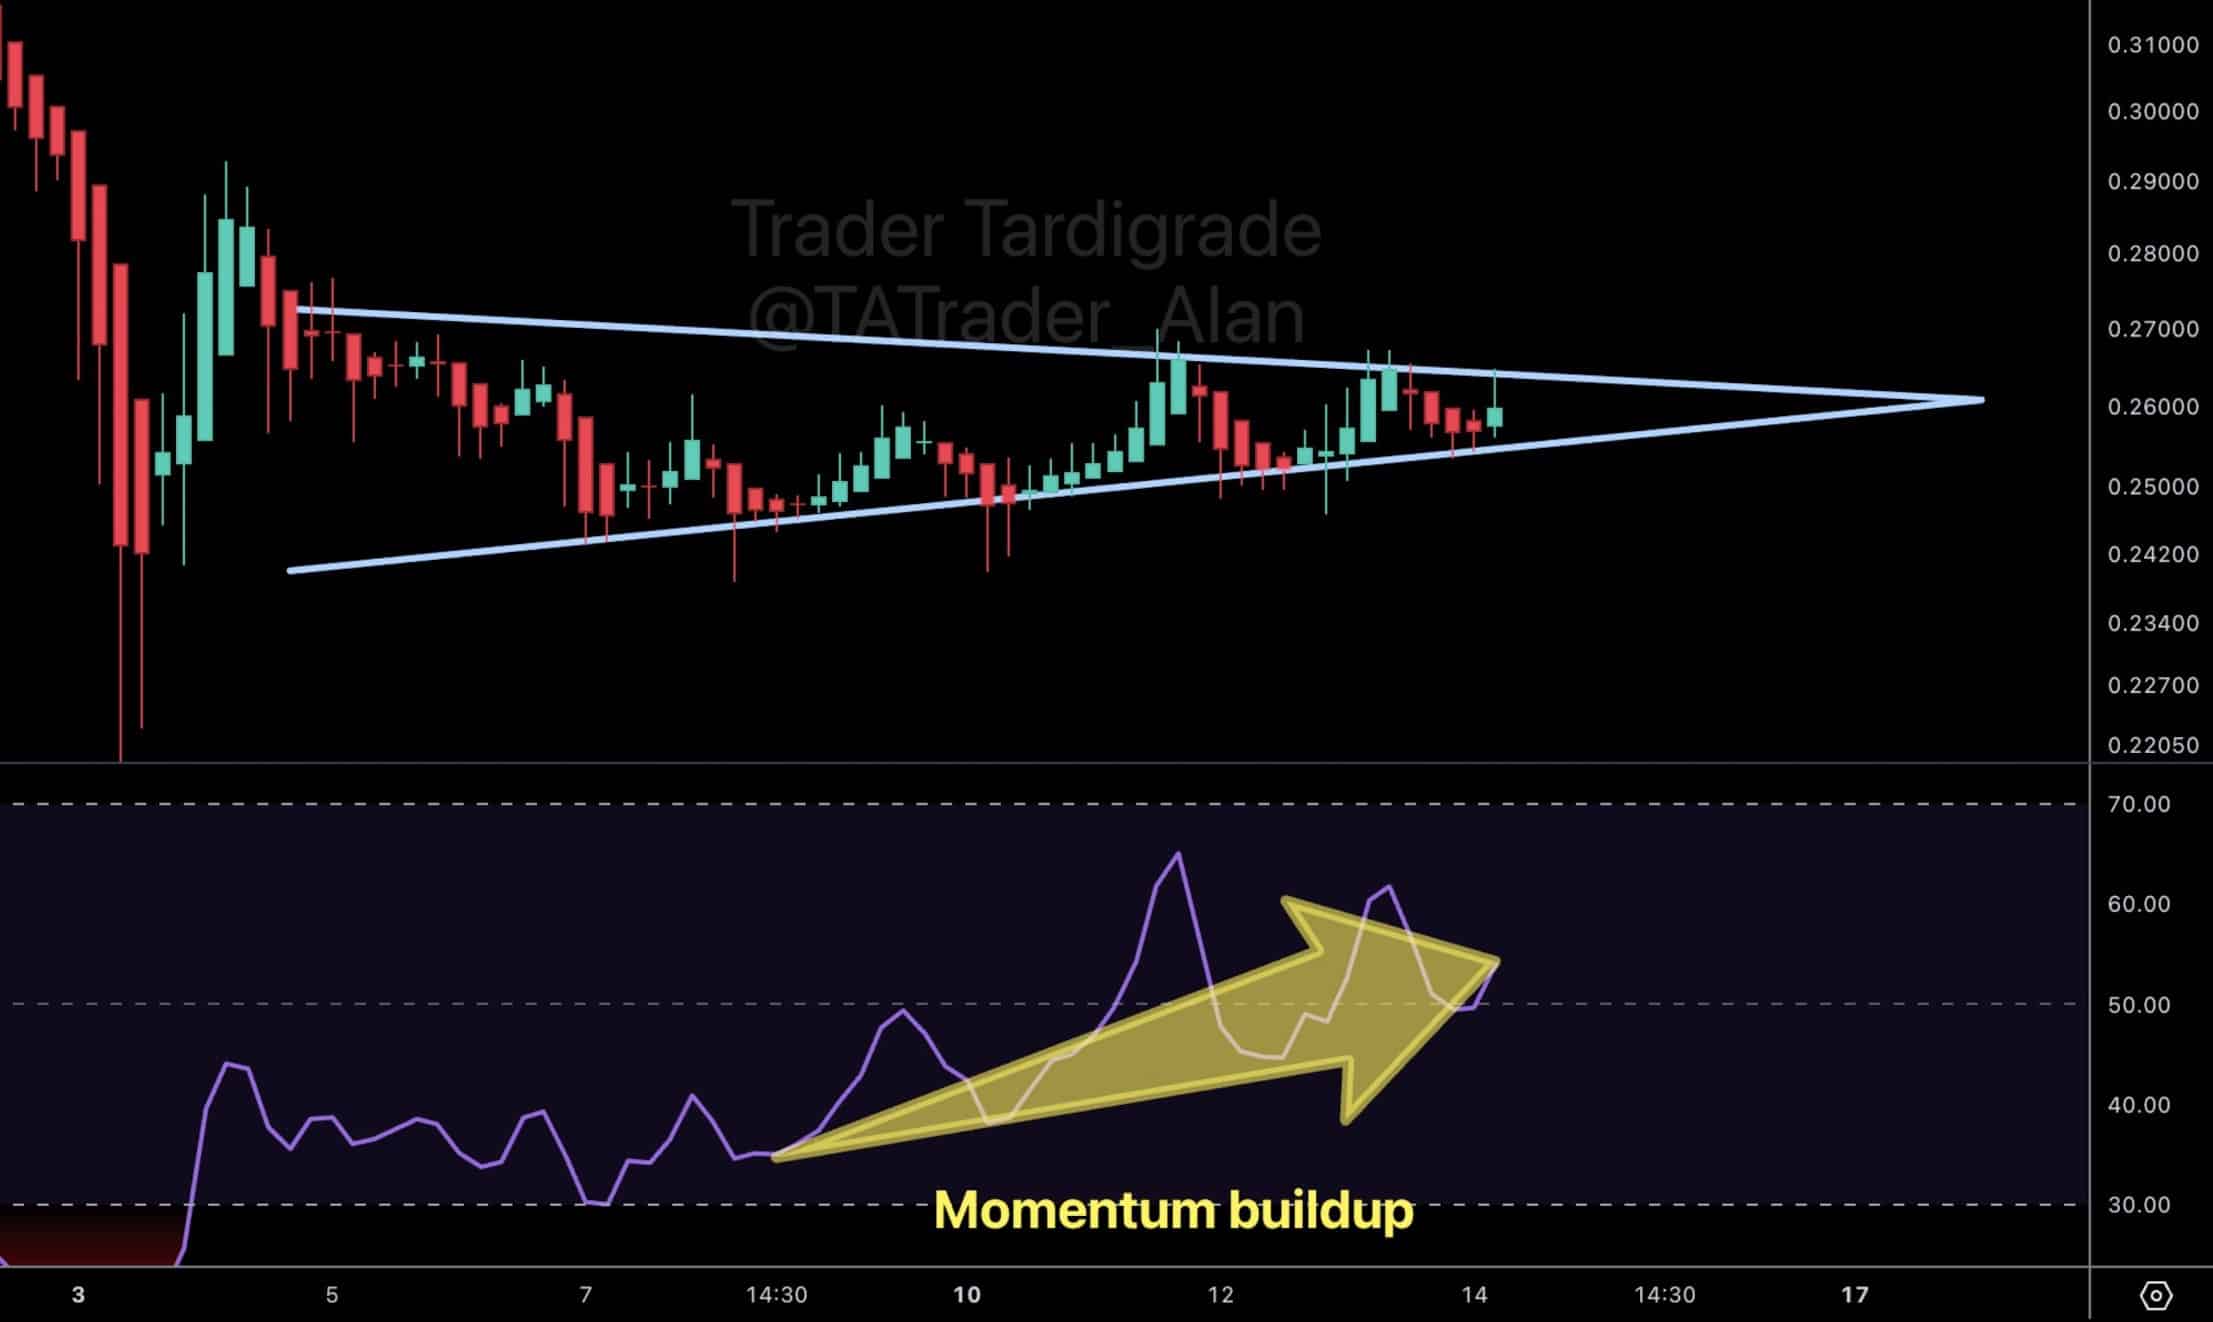
Source: Trader Tardigrade/X
Typically, if the RSI continues to rise and remains above the 50 level, it suggests that buying pressure is increasing, potentially leading to a breakout above the triangle.
Additionally, the Price Momentum Oscillator (PMO) indicates increasing bullish momentum, showing a positive slope that suggests the pace of Dogecoin’s price changes is accelerating.
This acceleration, combined with the tightening price pattern like the symmetrical triangle, often precedes upward price movements.
Source: Trader Tardigrade/X
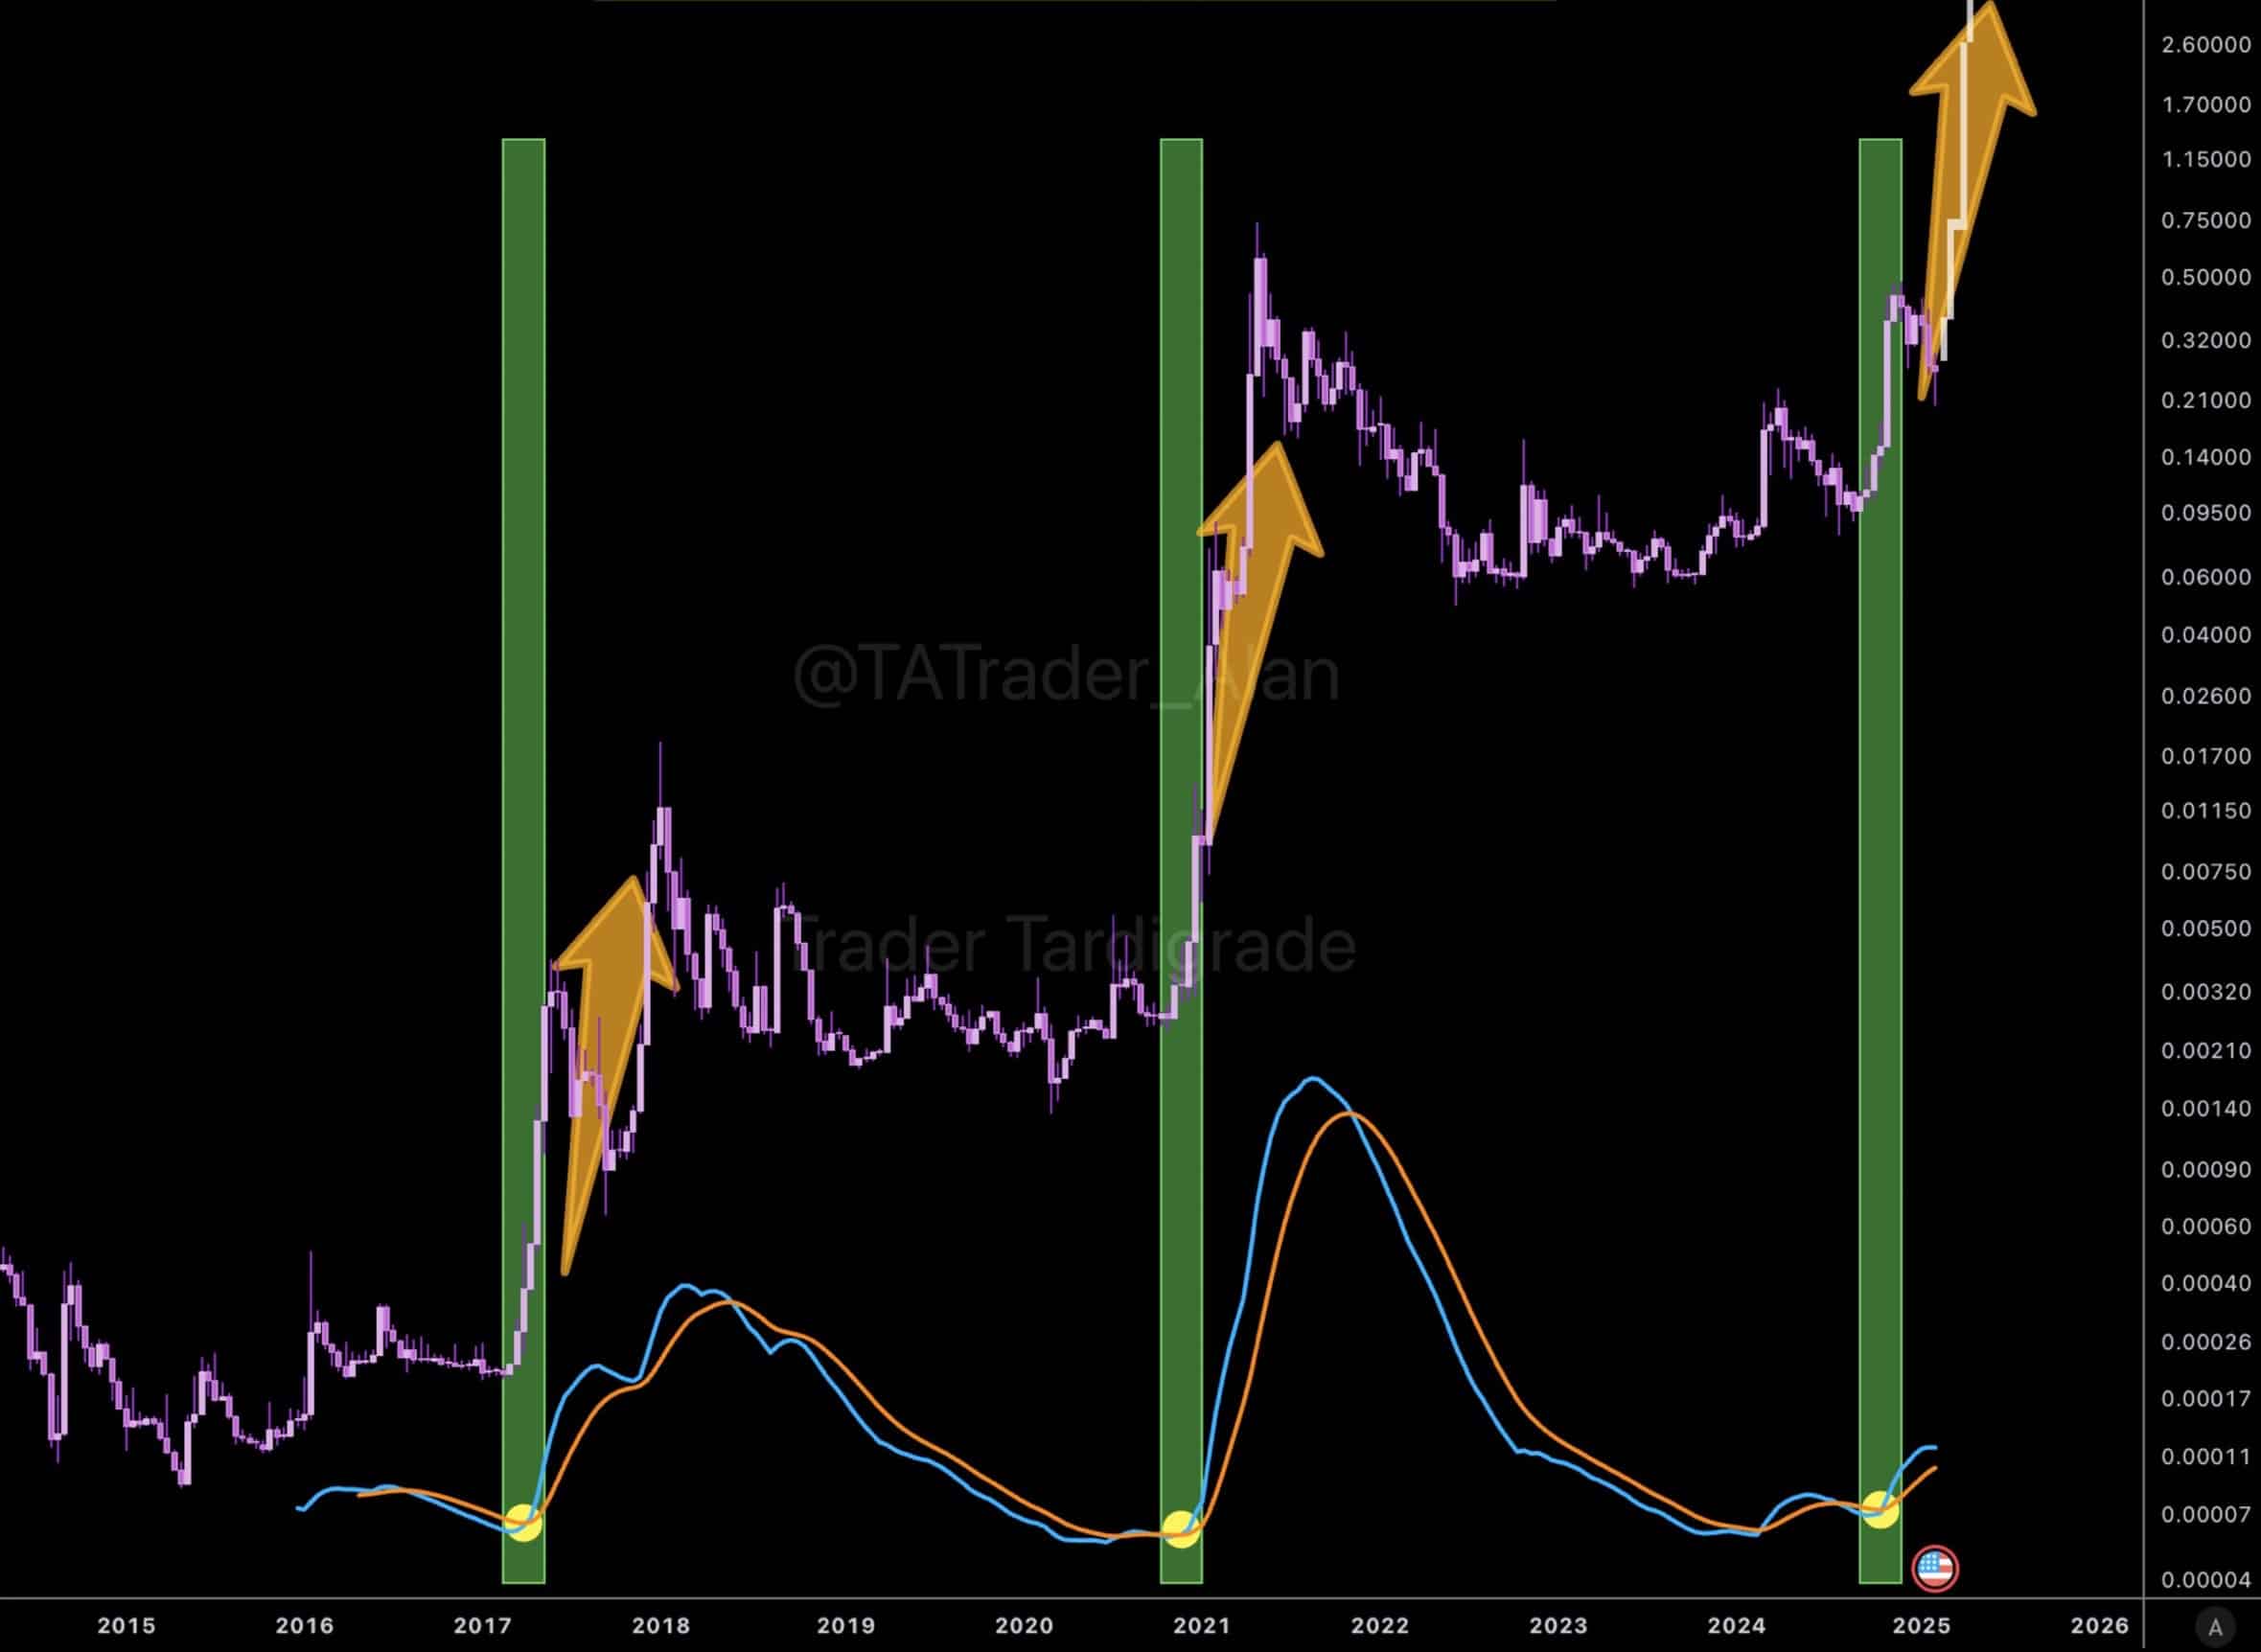
If these bullish signals lead to a breakout above the triangle, Dogecoin could see significant gains, potentially testing higher resistance levels at $0.50, $0.75, and eventually $1.
Conversely, if the momentum falters or the PMO and RSI turn downward, DOGE could break below the triangle, resulting in a sell-off.