- FET experienced a sharp decline to $0.34 during the recent market-wide selloff but has since rebounded nearly 50%.
- On-chain data reinforced stealth accumulation and potential smart money deployment.
Artificial Superintelligence Alliance [FET] wicked down to the $0.34 handle during the recent market-wide selloff. However, it has since reversed nearly 50%, flashing signs of strong dip demand.
In fact, over the last 72 hours, on-chain and CEX data show over 1 million FET scooped across the spot market. Hence, a clear sign of stealth accumulation.
Consequently, market makers are now eyeing $0.34 as a structural support level, potentially front-running a broader leg up.
If inflows persist, can FET set the stage for a breakout reversion toward the $1 macro resistance — which was last breached in late January before distribution set in?
Weekly growth underpins AI-driven market trend
On the weekly chart, the combined market capitalization of AI tokens surged from $21.33 billion to $24.43 billion, highlighting a strong capital influx over the past seven days. FET exemplifies this trend, showcasing solid price action.
During this period, FET outpaced large-cap assets with a 47% rally to $0.54 on the 13th of April. Prior to this breakout, its price action was range-bound in a multi-week accumulation zone – a textbook setup for volatility expansion.
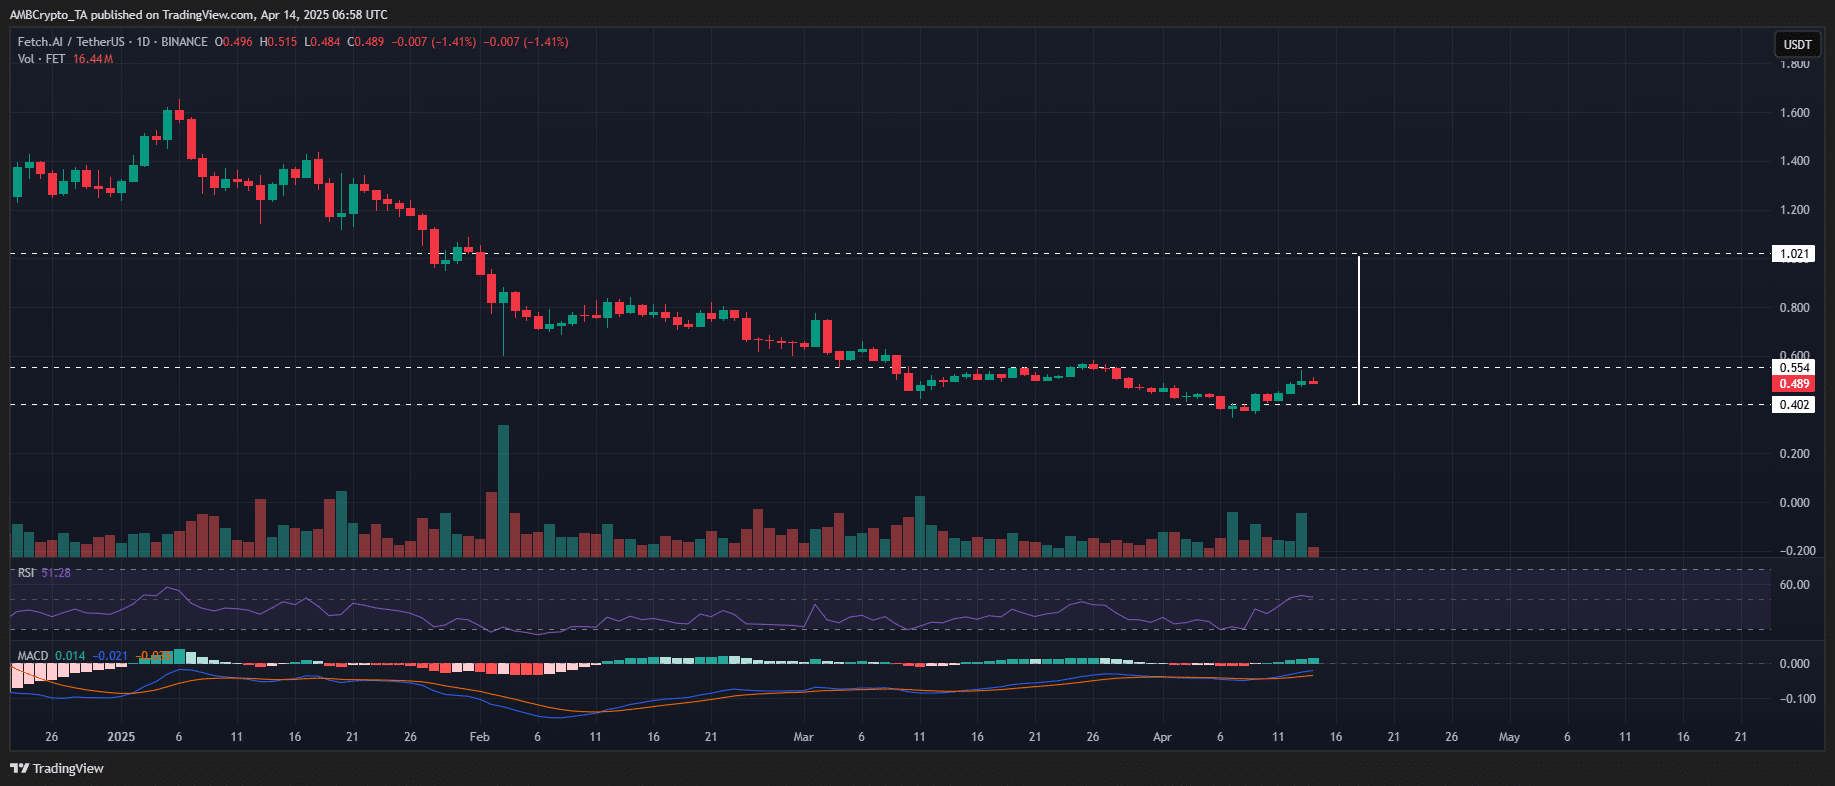
Source: TradingView (FET/USDT)
As mentioned earlier, on-chain outflows and CEX data validate the move, with accumulation trends signaling smart money front-running the breakout. Meanwhile, as capital continues to rotate into AI majors, speculation is mounting around a potential all-time high retest by the end of Q2.
Notably, with FET now ranked among the weekly top gainers, spot demand climbing, and technicals aligning for a range breakout, $0.34 may now be established as a structural launchpad.
Does this entire setup flip FET’s recent “dip” into a high-risk/reward opportunity?
FET’s undervaluation fails to draw smart money attention
FET’s undervaluation is reflected in its MVRV Z-score, which is currently at a two-year low of -1.50. Hence, below the green band, a region traditionally indicative of oversold conditions and potential accumulation zones.
Based on the chart, the $1.12 level aligns with the prior green-band interaction, suggesting a potential local bottom.
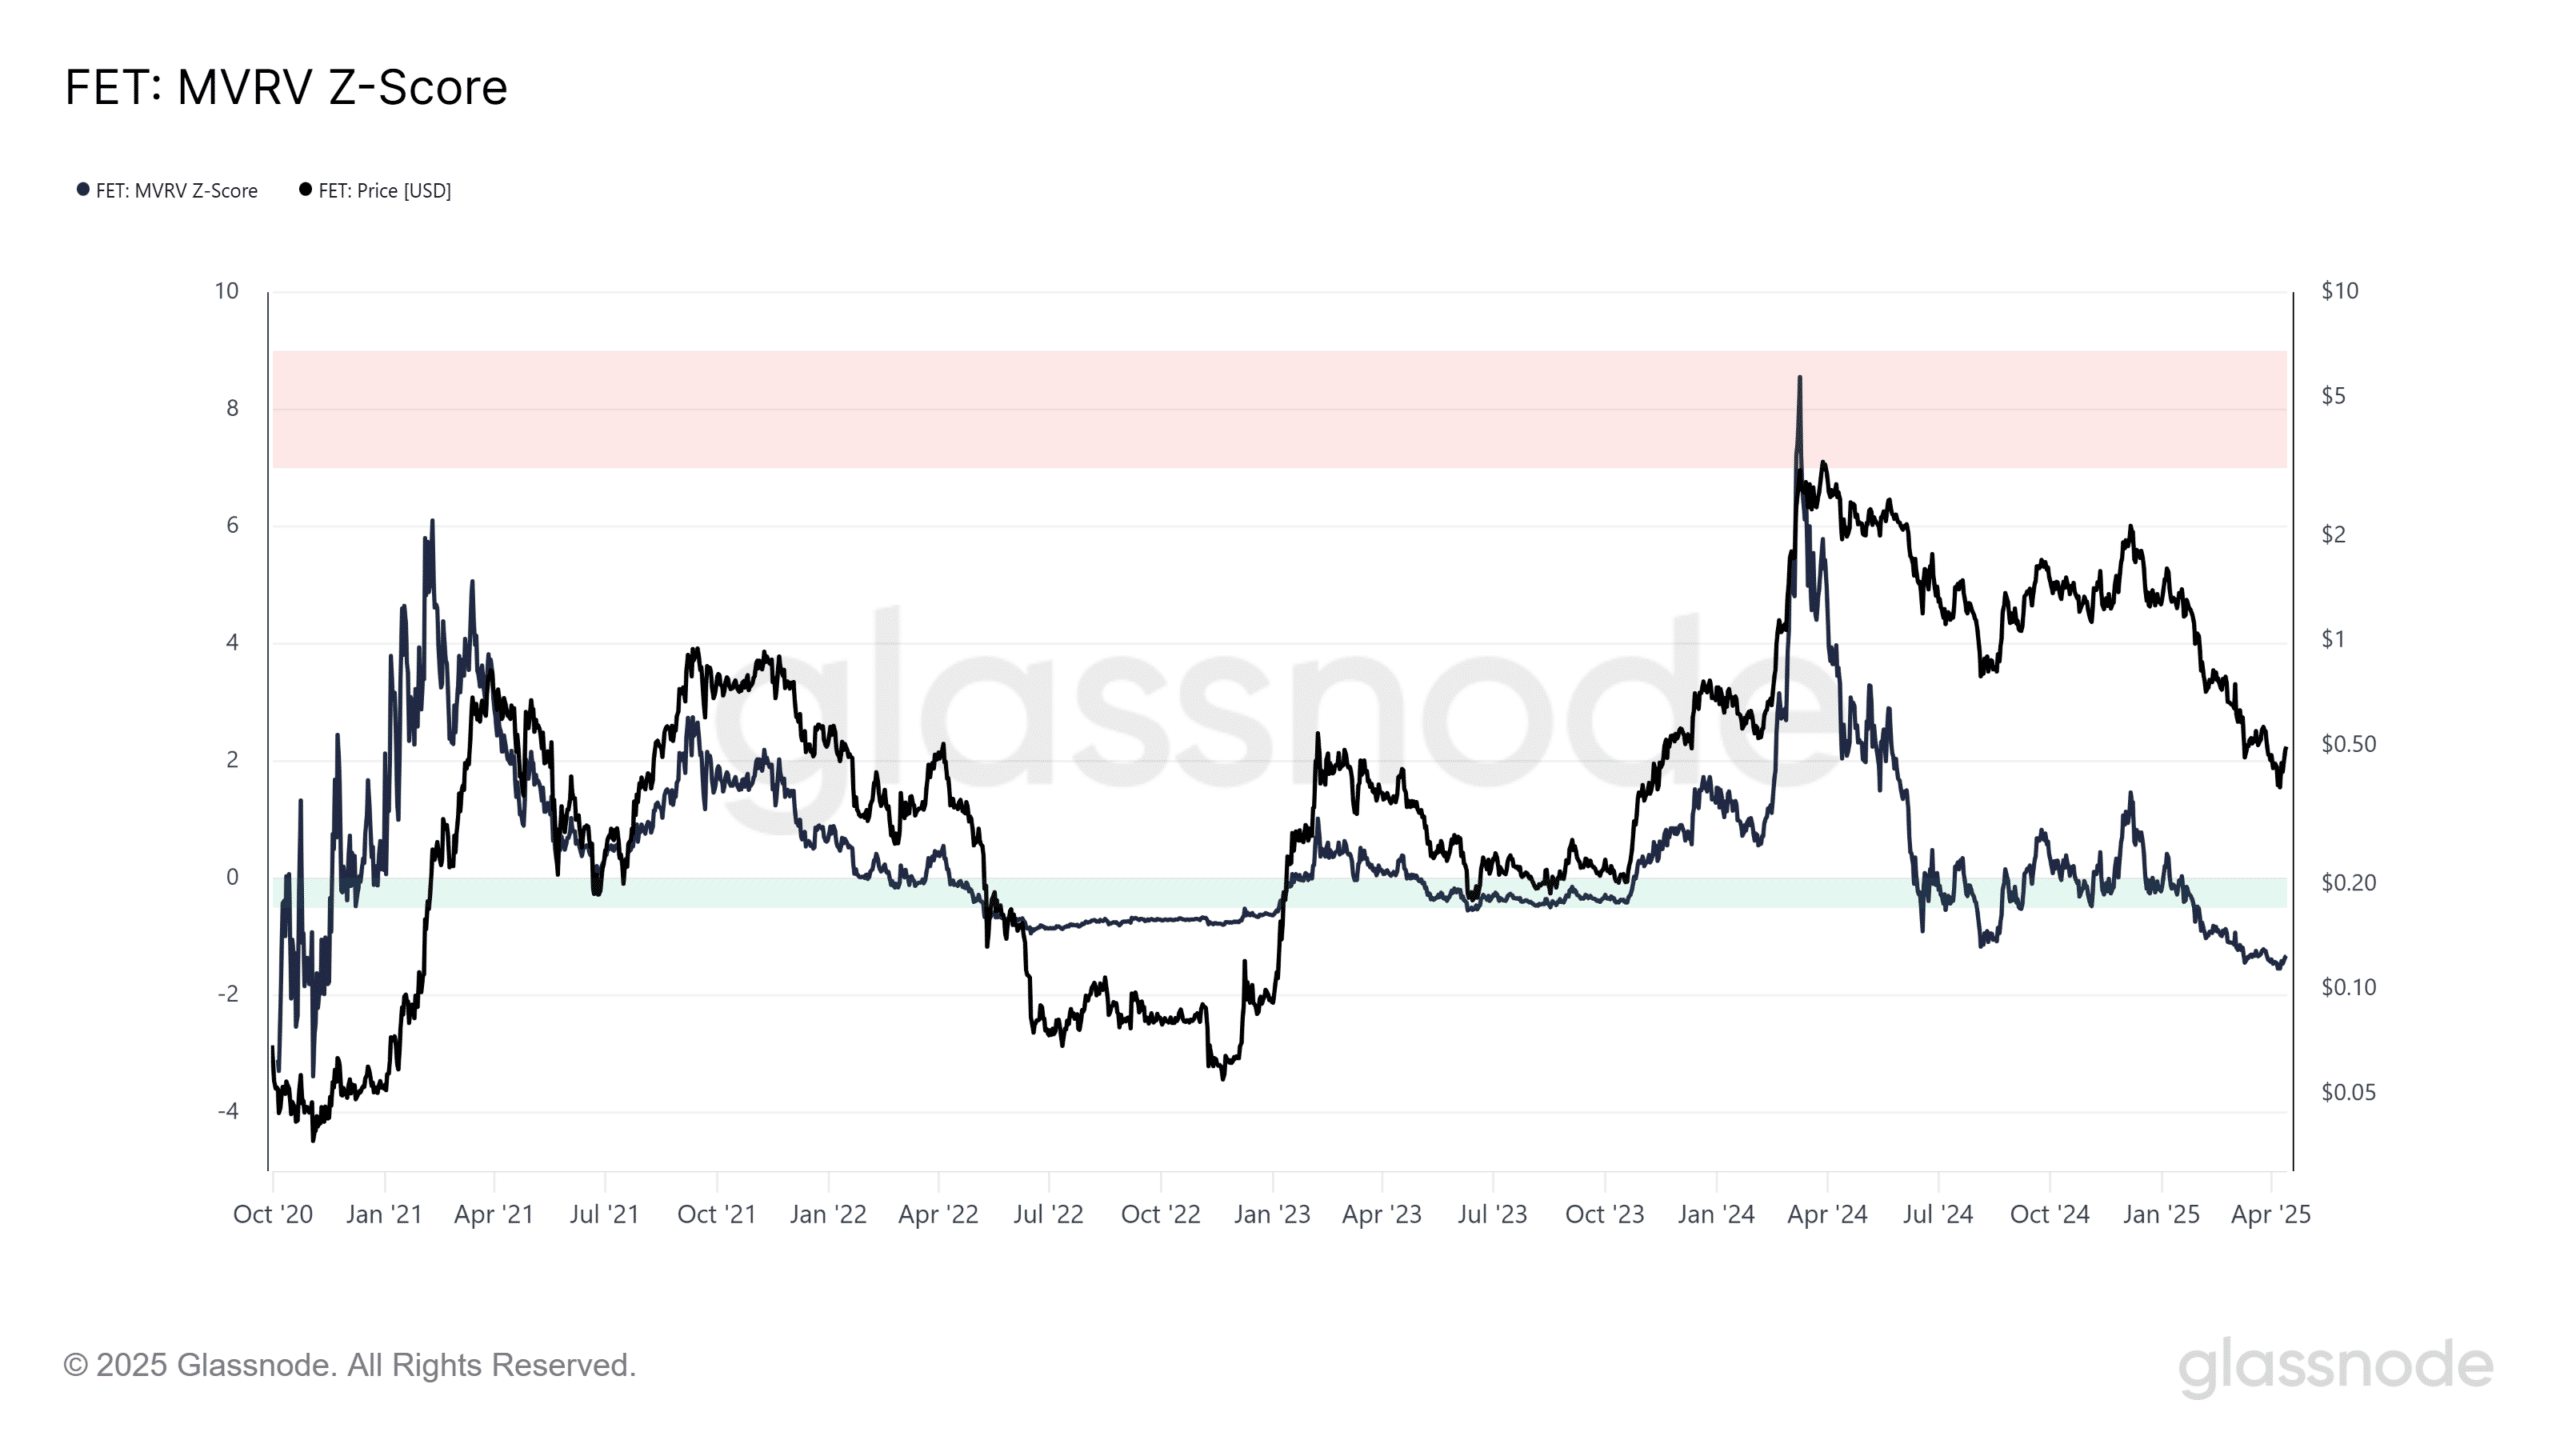
Source: Glassnode
However, FET’s Net Unrealized Profit/Loss (NUPL) has remained entrenched in the red since the 5th of January, when price action was at $1.60.
This correlates with a 70% Fibonacci retracement from the January high, bringing the asset to its current market price of $0.50, which points to an extended phase of market capitulation.
Why does this matter? This correlation shows institutional and smart money capital has largely stayed on the sidelines, unable to absorb the sell-side pressure, which prevented $1.12 from serving as a confirmed support zone.
The NUPL, still deeply negative, alongside a positive SOPR, suggests profit-taking is still active, showing the market hasn’t reached selling exhaustion. In short, sell-side liquidity remains high.
While early signs of smart money accumulation are emerging, net flows remain insufficient to absorb the overhead supply. This puts $0.34 at risk of failing as structural support – mirroring the breakdown at $1.12.