
In brief
- Bitcoin bounces back to $115K, but the technical picture suggests traders lack conviction.
- Ethereum shows the weakest trend strength among the three majors, despite reclaiming $4,200.
- Solana faces conflicting signals with bearish short-term momentum fighting bullish long-term structure.
The crypto market just lived through another violent reminder that leverage is a double-edged sword. On Friday, October 10, President Donald Trump unleashed a message on Truth Social promising to impose 100% tariffs on all Chinese products starting November 1, triggering a global chain reaction that saw Bitcoin plunge from above $125,000 to briefly below $102,000, and Ethereum drop to below $3,800.
The carnage was historic: 1.6 million traders liquidated and $19 billion evaporated in what became the largest single-day wipeout in history, with losses worse than the FTX collapse in 2022 and the COVID market crash before it—combined, and by several multiples.
Before the crash, the markets were bullish, with traders largely betting on new all-time highs across crypto, according to Myriad—a prediction market developed by Decrypt’s parent company Dastan. But nobody expected Trump to nuke their bags—at least nobody except one “lucky” trader who shorted the market just before the tariff announcement and pocketed millions from the crash.
But here’s the thing about crypto crashes: They tend to reset the playing field. Now, as the dust settles and prices recover, traders are asking the obvious question: Was this the flush the market needed before heading higher, or the beginning of something worse?
Bitcoin price: Trend confirmed, but barely
Traders on Myriad currently expect Bitcoin to continue its rebound, placing odds at above 90% that BTC stays above the $112K mark by tomorrow. Myriad users also expect BTC to sooner hit $120K again before crashing down to $100K, with the line currently set at 74% for a continued push upward.
Bitcoin currently trades at $115,089, having recovered from the flash crash lows after bouncing near the 200-EMA—the average price of Bitcoin over the last 200 days. But don’t let the price bounce fool you—the technical picture reveals a market that’s recovered but not convinced.
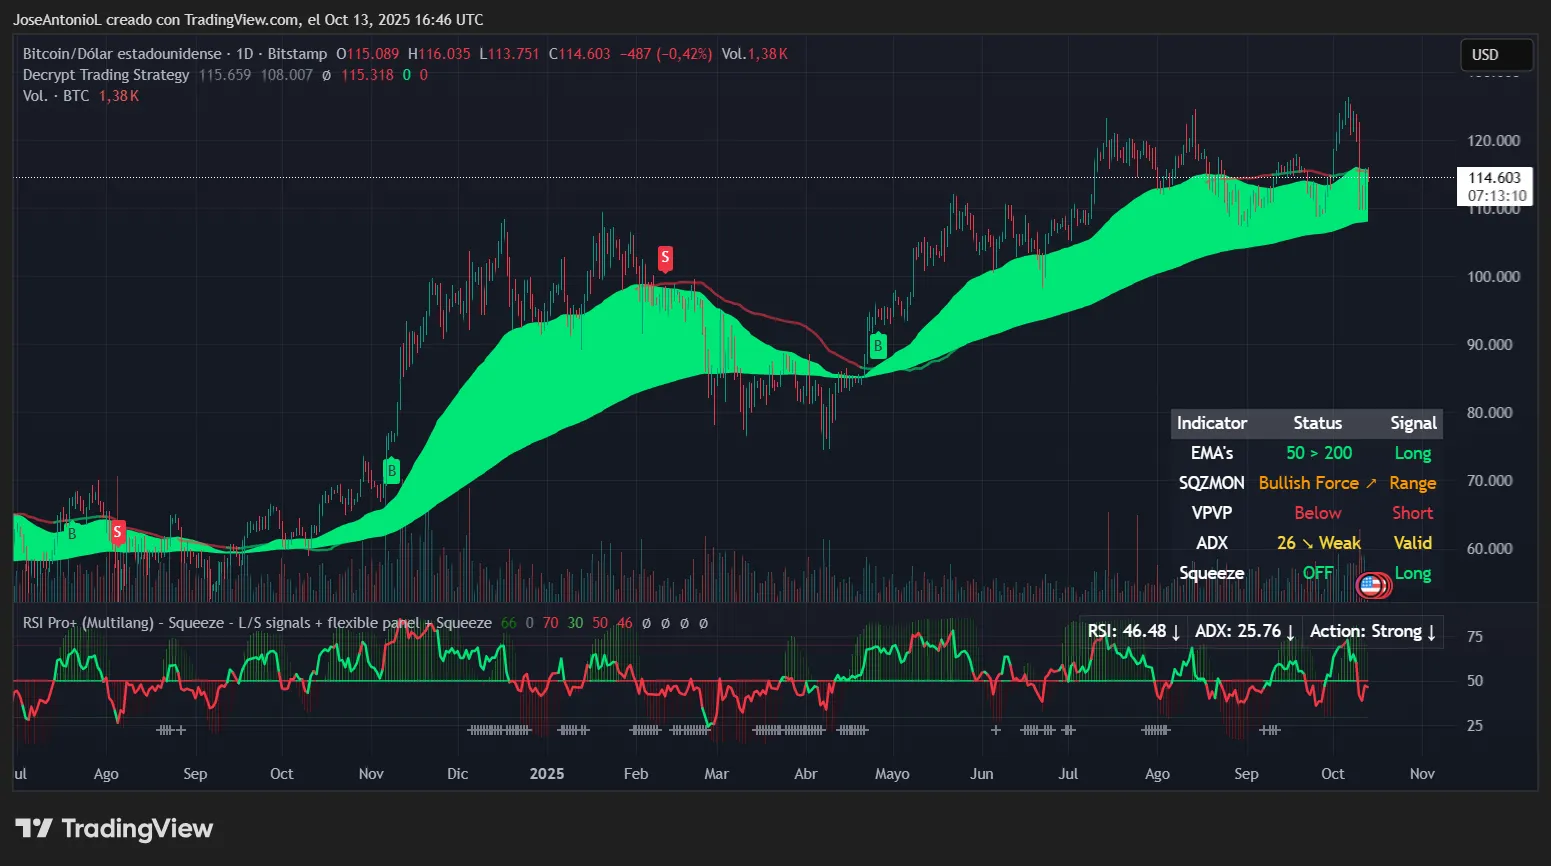
The most telling indicator is the Average Directional Index, or ADX, sitting at 25.76. The ADX measures trend strength on a scale from 0 to 100, where readings above 25 confirm a trend is in place. Bitcoin just crossed this threshold, which technically signals trend establishment. Think of it like a car that’s finally shifted into gear after idling—we’re moving, but we’re not exactly racing yet. For traders, this reading suggests we’ve exited the choppy, directionless waters, but the trend isn’t strong enough to inspire confidence in aggressive positioning.
The Relative Strength Index, or RSI, for Bitcoin is at 46.48, which adds another layer of caution. RSI measures momentum, with readings above 70 indicating overbought conditions (time to potentially sell) and below 30 signaling oversold (time to potentially buy). At 46.48, Bitcoin sits in neutral territory with a slight bearish tilt—not exactly the reading bulls want to see after such a dramatic selloff. This suggests the bounce lacks the aggressive buying that typically marks major bottoms, so much that it wasn’t enough to take prices up over the 50-day EMA reference.
The good news? Bitcoin’s 50-day exponential moving average remains above the 200-day EMA, a configuration that typically indicates bullish long-term structure. EMAs give traders a sense of price supports and resistances over the short, medium, and longer term.
When short-term averages stay above long-term ones, it suggests sustained buying pressure over time. The Squeeze Momentum indicator showing “off” status with a Long signal adds to the bullish case, indicating the recent consolidation phase has been released with upward bias.
With such a lack of momentum, prices could be bouncing hard between $110K and $125K until something triggers a movement in either direction.
Key Levels:
- Immediate support: $110,000 (psychological level)
- Strong support: $107,000 (flash crash low, must hold)
- Immediate resistance: $118,000 (pre-crash consolidation)
- Strong resistance: $125,000 (all-time high zone)
Ethereum price: Weakest trend among majors
As for Ethereum, Myriad traders are likewise bullish on a sustained rebound: The market is currently pricing in 94% odds that ETH stays above $3,800 by Tuesday.
And you could understand why: Ethereum’s recovery to $4,156 looks impressive on the surface. But the technical data tell a more cautious story.
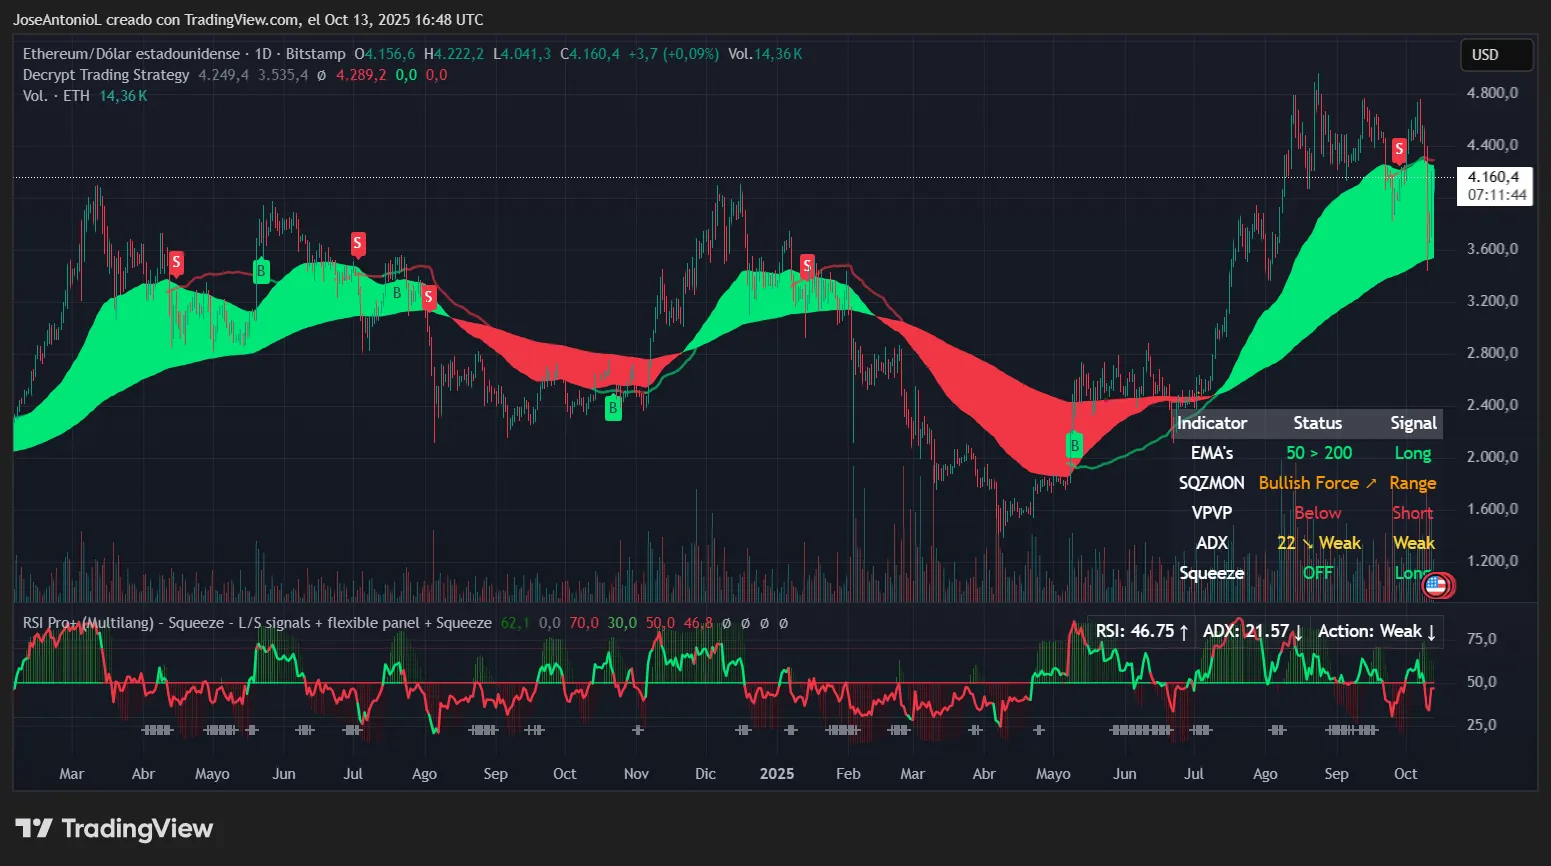
The ADX at just 21.57 reveals the weakest trend strength among the three crypto majors: Bitcoin, Ethereum, and Solana. ETH’s ADX is below the crucial 25 threshold that confirms directional movement and has finally deleted any strong momentum registered by its impressive bullrun. This reading tells traders the market lacks conviction, suggesting ETH is drifting rather than decisively moving in either direction.
The RSI at 46.75 mirrors Bitcoin’s neutral-to-bearish reading, indicating neither buyers nor sellers have taken control post-crash.
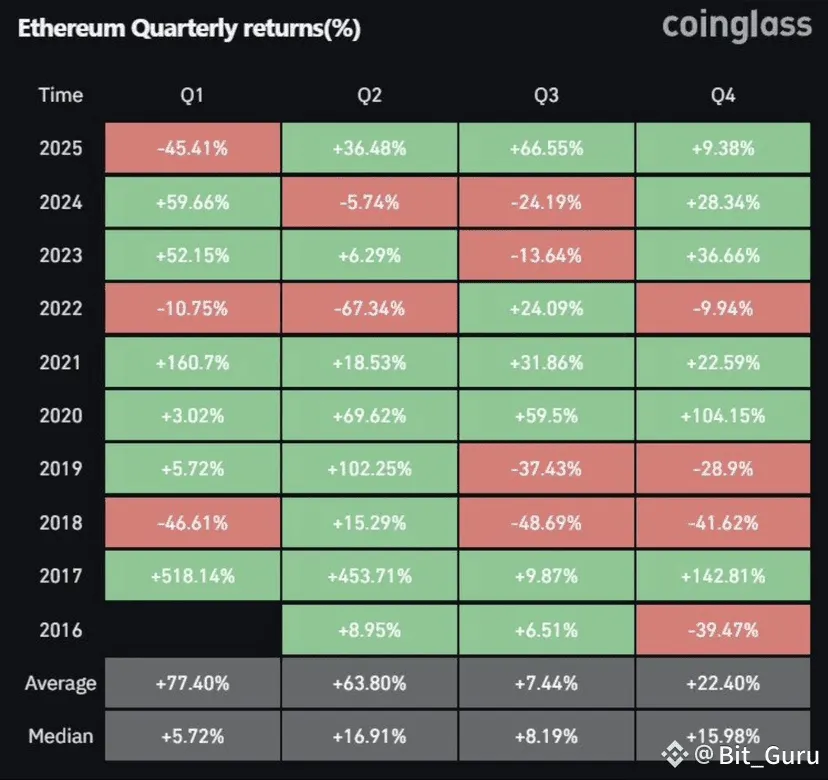
Historical fourth-quarter data supports potential upside with Ethereum posting strong gains in past years: +104% in Q4 2020, +142% in Q4 2017, and averaging nearly +22.4% in Q4, but the current technical setup suggests patience may be required before that seasonal strength kicks in.
Like Bitcoin, ETH maintains its golden cross with the 50-day EMA above the 200-day EMA, preserving the longer-term bullish structure. The Squeeze Momentum indicator firing “off” with a Long signal suggests the consolidation phase is ending with an upward bias—but with such weak ADX readings, any move higher may lack follow-through.
Key Levels:
- Immediate support: $3,950 (recent bounce level)
- Strong support: $3,500 (near flash crash low)
- Immediate resistance: $4,250 (technical confluence)
- Strong resistance: $4,800 (psychological target)
Solana price: Trading slow
Myriad traders are equally bullish on Solana’s short-term price prospects, placing odds at 88% that SOL continues to trade above $185. Users on Myriad, though, aren’t as convinced on the longer term prospects, placing odds at just 44% that SOL hits a new all-time high above $294 before the end of the year. Those odds are up from 33% on Friday, following the market crash.
Solana presents the most complex technical picture, currently trading at $197.22, with conflicting signals across different timeframes creating a particularly challenging setup for traders.
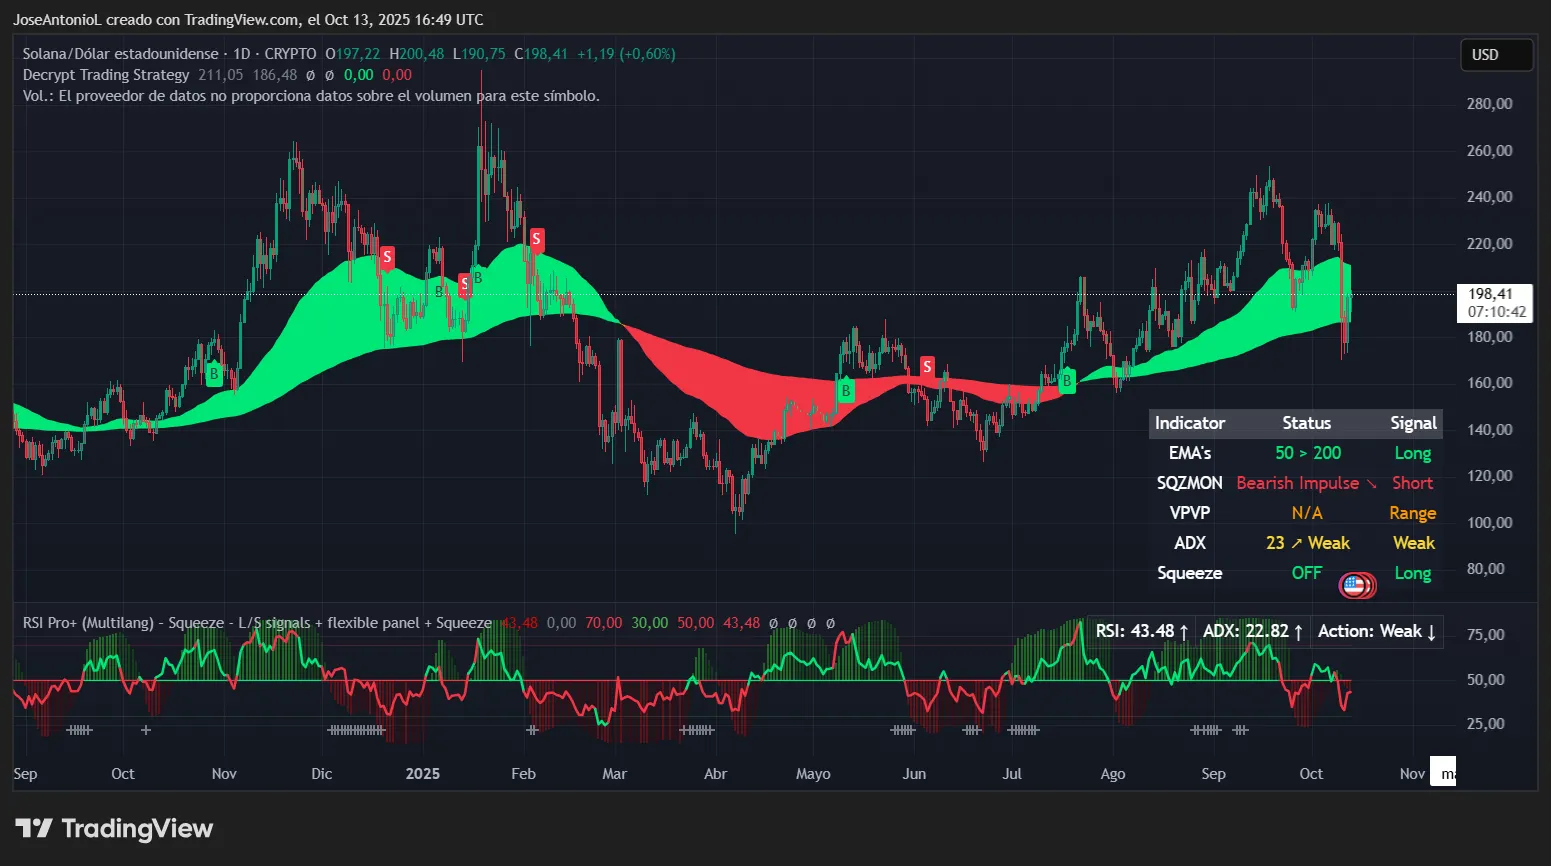
The ADX at 22.82 sits below the 25 trend confirmation level, indicating weak directional movement similar to Ethereum. So basically, SOL is caught in a transitional phase where neither bulls nor bears have established clear control.
The RSI at 43.48 leans bearish, sitting below the neutral 50 level and suggesting selling pressure slightly outweighs buying interest. For context, RSI readings between 40-50 often occur during corrective phases within uptrends—not quite oversold enough to trigger aggressive buying, but weak enough to concern holders.
The bulls are also trying to position prices above the 50-day EMA, but things are not looking too optimistic. The gap between the short- and long-term averages is decreasing, the bounce was weaker than the dip, and the coin is likely to register a lower high before a major bullish tick.
Analysts note SOL sits just 0.22 within the Bollinger Bands, indicating extreme oversold conditions that historically precede strong bounces. However, with conflicting momentum signals, traders should expect choppy price action as the market works through this indecision.
Key Levels:
- Immediate support: $180 (psychological level)
- Strong support: $160 (must hold for bulls)
- Immediate resistance: $220 (initial target zone above the EMA50)
- Strong resistance: $240 (stronger resistance)
BTC, ETH and SOL: Caution warranted despite recovery
While all three cryptocurrencies have bounced from their crash lows, the technical indicators universally suggest this recovery lacks conviction. Bitcoin shows the strongest setup with ADX confirming trend establishment, but barely. Ethereum and Solana both display weak trend readings that typically precede choppy, range-bound trading rather than sustained directional moves.
The conflicting signals—bullish long-term EMAs versus weak momentum readings—suggest the market is digesting the massive liquidation event rather than confidently moving forward. Traders would interpret this as healthy market behavior after such dramatic deleveraging, but it also means traders should expect continued volatility in the near term.
Several altcoins crashed between 20% to 40% as the market recoiled, and the data suggests bulls may need to be patient as the recovery could take time rather than following a swift V-shaped pattern. With trend strength readings this weak across the board, the prudent approach is to wait for clearer signals before making aggressive directional bets.
Disclaimer
The views and opinions expressed by the author are for informational purposes only and do not constitute financial, investment, or other advice.
Daily Debrief Newsletter
Start every day with the top news stories right now, plus original features, a podcast, videos and more.