Key Takeaways
Liquidity grew in OKB, as both spot and derivative buying volumes rose. A bullish triangle pattern remains likely, supported by strong indicators.
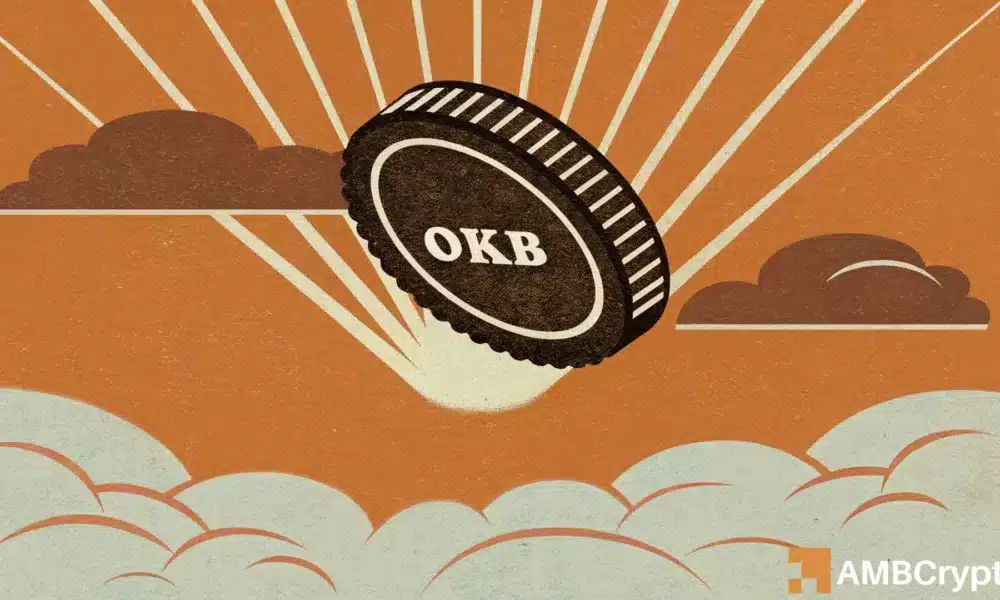
Over the past day, OKB [OKB] has been on the rise, with inflows driving the asset up by 12.28%, bringing its total accumulated gain to 180%.
Market sentiment and trading activity suggest that a major rally toward a new all-time high could be the token’s next phase.
Liquidity flows into the market
Liquidity has been pouring into the market over the past few days, accompanied by high volumes in both spot and derivatives trading.
According to CoinGlass in the past 48 hours, spot investors collectively purchased $3.69 million worth of OKB and moved it into private wallets.
The derivatives market has not been left out, as long traders increased their exposure to OKB within the same period.

Source: CoinGlass
At the time of writing, the Open Interest Weighted Funding Rate rose to 0.0098% after previous declines, suggesting more long positions are being opened and funded.
Meanwhile, the Long/Short Ratio was 1.10 at press time, indicating that the majority of exchanges were seeing derivative volumes driven primarily by long traders.
All-time high for OKB?
AMBCrypto’s analysis of the price chart showed that OKB was trading within a bullish triangle pattern, formed by a horizontal resistance level and a diagonal support line.
At press time, OKB was testing the upper resistance. If it breaks above this level, the token could rally to a new all-time high, surpassing the $142 mark.

Source: TradingView
However, failure to breach this phase would imply that the asset continues to consolidate within the bullish pattern before eventually breaking out to a new high.
This comes after a previous AMBCrypto report highlighted how investors drove selling pressure in the market at the time.
Indicators support the rally
Technical indicators back the bullish setup. The Money Flow Index (MFI) suggested that liquidity inflows were still building.
At press time, the MFI reached one of its highest levels—73.58—signaling strong buying activity, with investors yet to show signs of exiting the asset.

Source: TradingView
Adding to the bullish sentiment is the Average Directional Index (ADX), which measures trend strength.
Currently, the ADX is rising alongside price, suggesting that the bullish trend remains intact and that a breakout from the pattern is likely to follow.
Overall, the likelihood of OKB reaching a new all-time high is strong, and the asset appears ready for major gains.