
- Polygon’s token has a bearish outlook on the 1-day and 1-week timeframes.
- The $0.3 psychological resistance level and the $0.285 resistance need to become supports before POL can initiate an uptrend.
The Polygon [POL] (previously MATIC) token has gained 15% in three days. Its short-term momentum and a nearly 40% increase in daily trading volume were good signals for lower-timeframe traders.
However, the higher timeframe trend was bearish. Hence, swing traders and POL investors must be wary of seller dominance in the coming days and weeks.
POL shows mixed signals across timeframes- bulls remain cautious
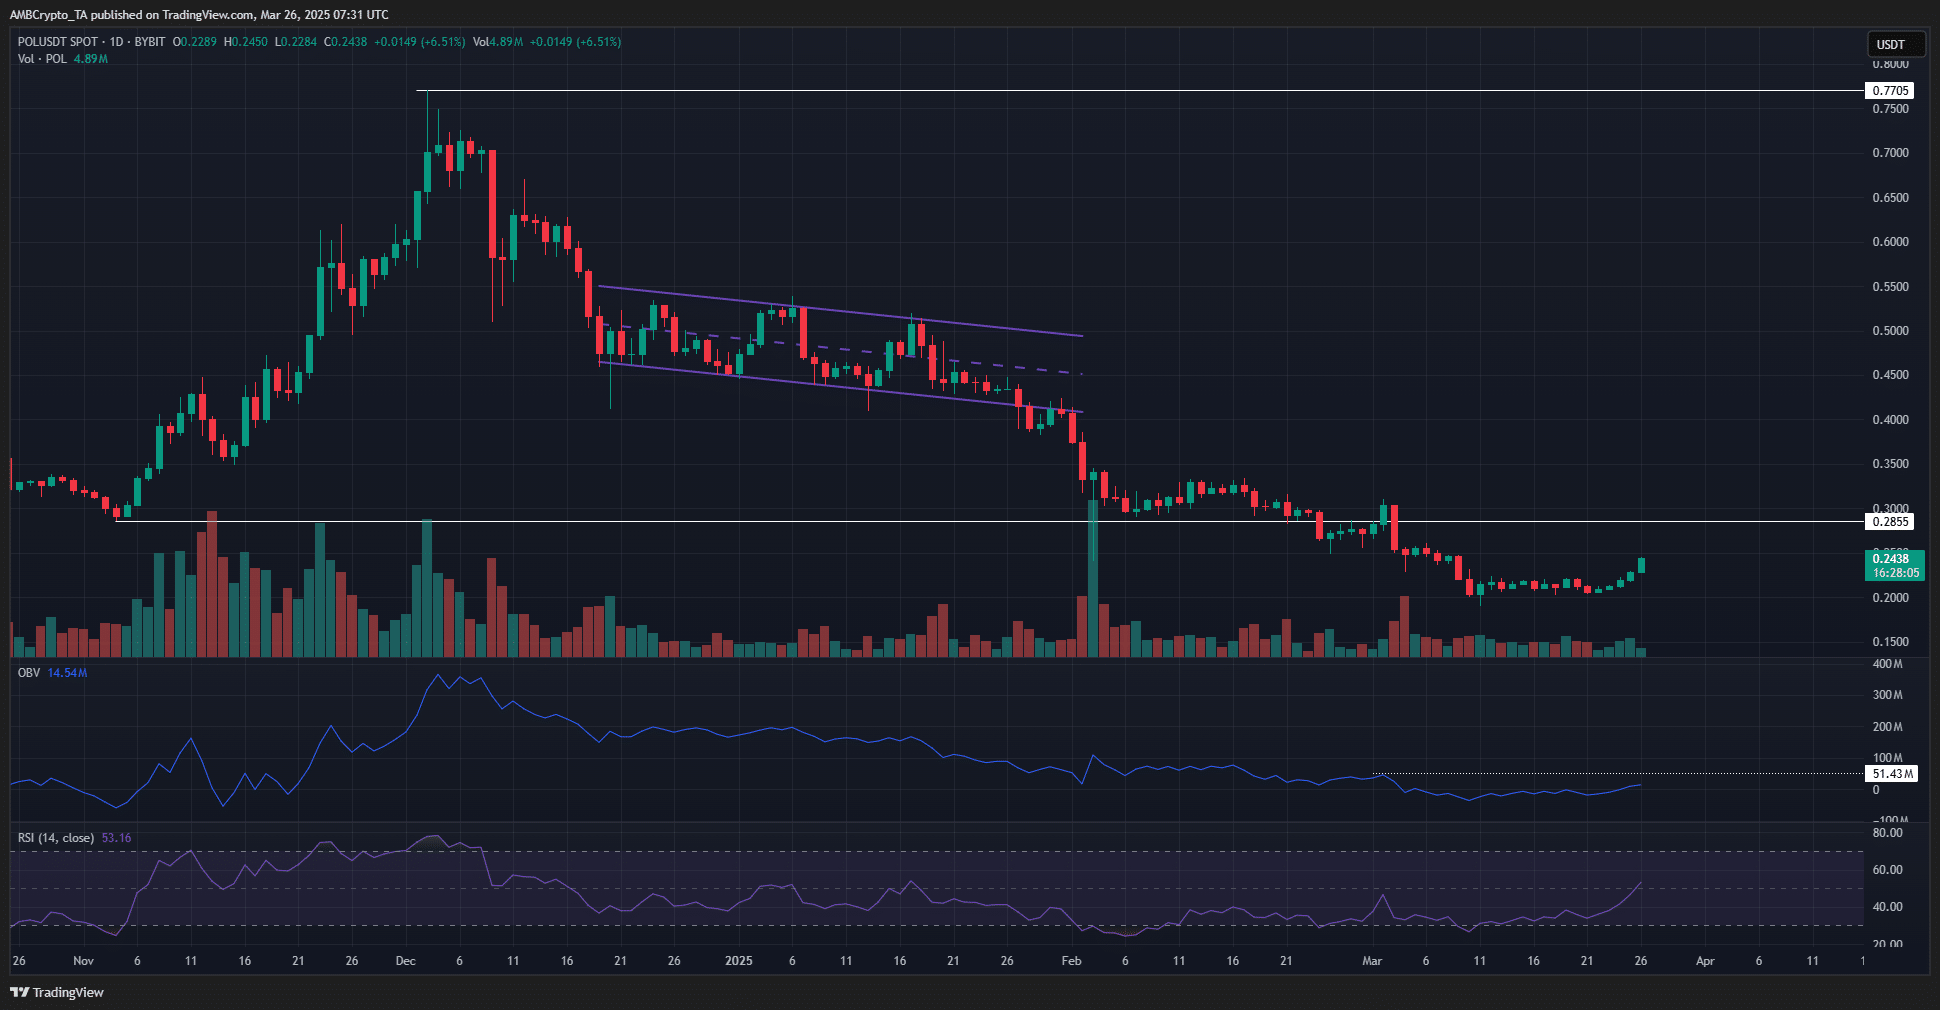
Source: POL/USDT on TradingView
In the year’s early weeks, Polygon traded within a descending channel. Toward late February, it dipped below previous lows, accelerating the ongoing downtrend. The daily chart shows that this decline has yet to reverse.
Key swing levels on the weekly chart are marked at $0.285 and $0.77. At the time of writing, POL was trading below these levels, reflecting a bearish market structure on both daily and weekly timeframes.
Despite this, technical indicators suggest brewing bullish momentum. Over the past ten days, the OBV has been climbing, signaling increased buying pressure.
Similarly, the RSI was moving toward the neutral 50 level, hinting at a potential bullish momentum shift on the 1-day chart.
However, the $0.285–$0.3 zone remains a likely strong resistance level. If demand continues to falter in the coming days, the probability of breaking above $0.3 appears low.
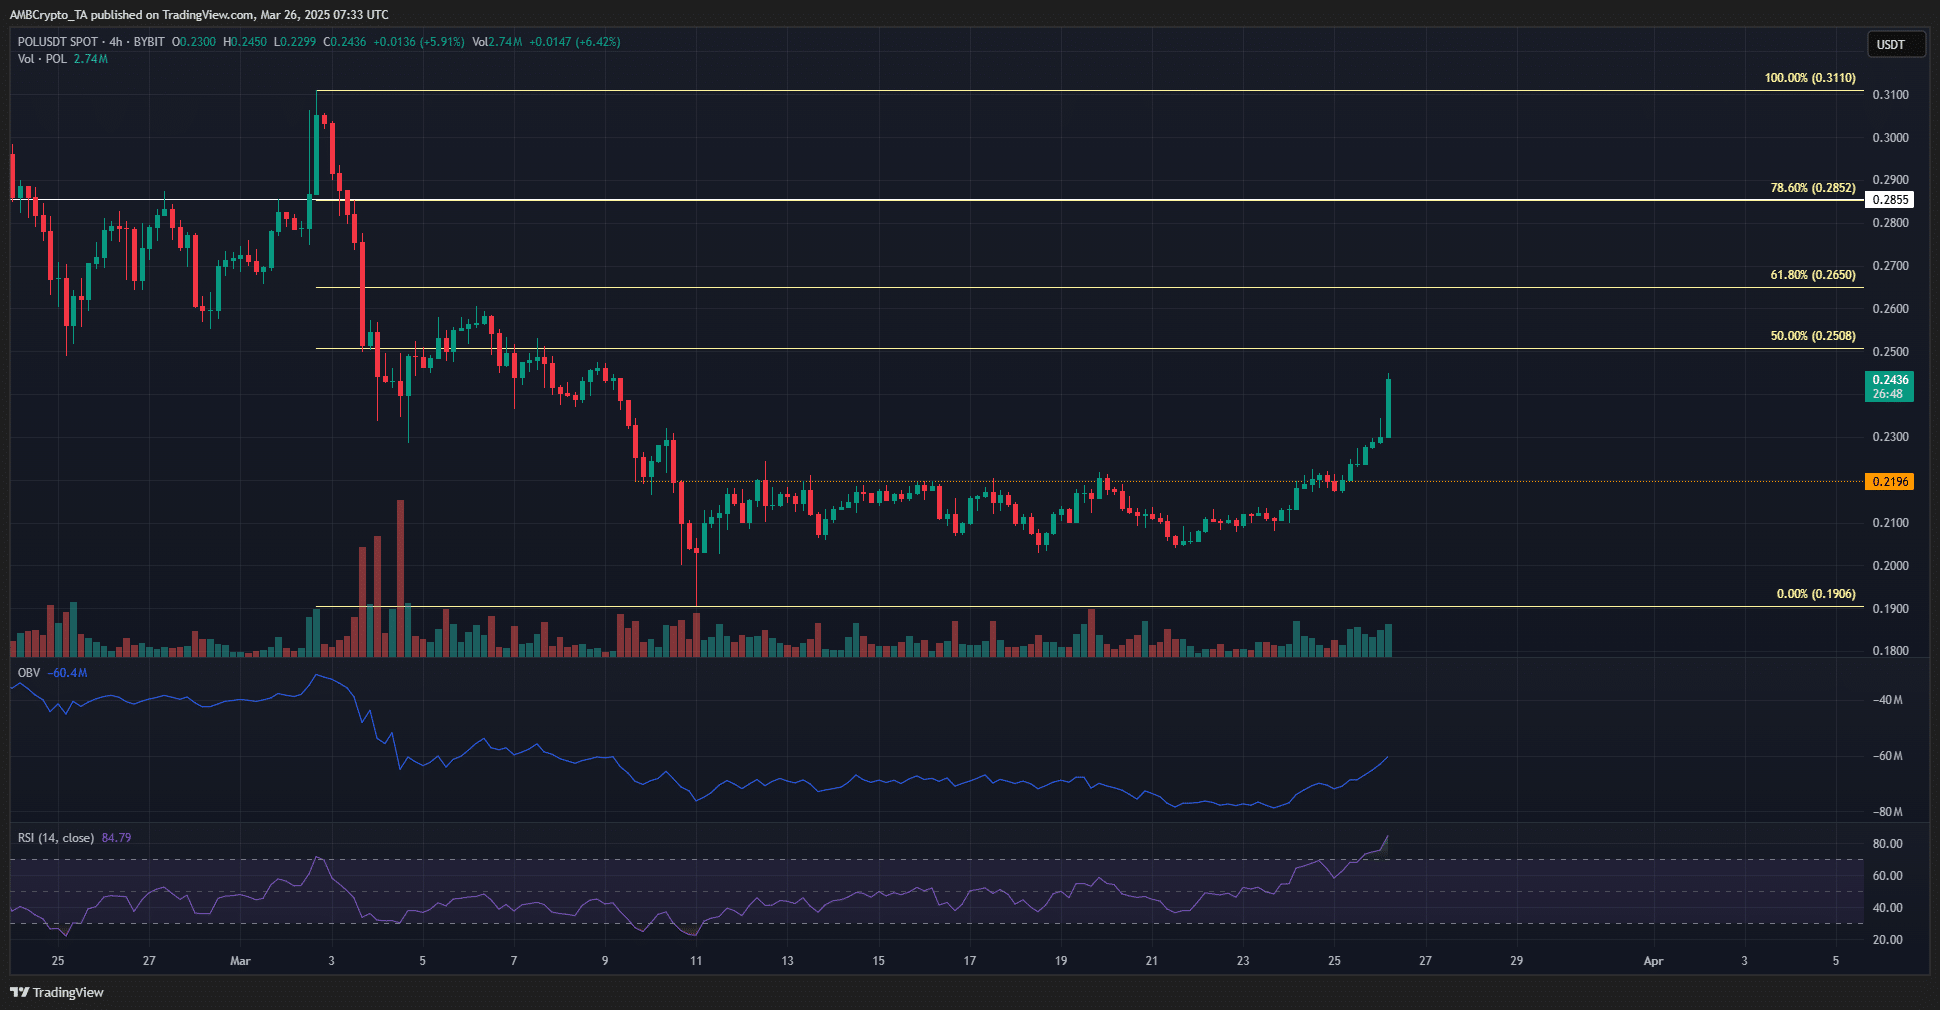
Source: POL/USDT on TradingView
On the 4-hour chart, the short-term bullish momentum was evident. The RSI has shot higher into the overbought territory, standing at 84 at press time.
he price has broken above the local resistance zone at $0.22, marked in orange. At the same time, the OBV has reached a higher high compared to the past two weeks.
The strong gains over the past two and a half days have given POL a bullish structure on the 4-hour timeframe. However, the overall trend remains bearish, as indicated by Fibonacci retracement levels.
A move above $0.26 could shift the H4 swing structure to bullish, though the $0.265 and $0.285 levels remain significant resistance points.
Therefore, bulls should be cautious about jumping into long trades amid the current momentum. Instead, they may want to observe POL’s reaction at key resistance levels around $0.26 and $0.285 to determine whether a bearish reversal is likely.
Disclaimer: The information presented does not constitute financial, investment, trading, or other types of advice and is solely the writer’s opinion