
- Chainlink formed an inverse head-and-shoulders pattern, supported by a bullish EMA crossover.
- On-chain activity aligned to support a potential breakout above $15.30.
Chainlink [LINK] is gradually building momentum after several weeks of sideways movement, positioning itself for a potential breakout. At the time of writing, LINK traded at $15.02 – a 0.55% gain over the past 24 hours.
This price action comes as bulls attempt to overcome the stubborn $15.30 resistance. Multiple technical and on-chain signals now align in favor of buyers.
However, broader confirmation still depends on a decisive breakout and sustained strength above the current consolidation zone.
Breaking down Chainlink’s technical setup
LINK has formed an inverse head-and-shoulders pattern on the 4-hour chart, with the neckline at $15.30. This bullish reversal structure signals a likely trend shift if price clears resistance.
Additionally, the 9 EMA has crossed above the 21 EMA, confirming short-term momentum strength. The moving average crossover supports the idea that bulls are regaining control.
However, LINK must achieve a clear breakout above the neckline to validate this setup. Otherwise, rejection may extend consolidation in the $14.50–$15.30 range.

Source: TradingView
Rising deposits spark caution
Exchange metrics offer a mixed narrative. Over the past seven days, exchange reserves declined by 1.03%, which suggested reduced sell-side pressure. Therefore, long-term outlook appeared less bearish.
However, exchange netflows spiked 37.46% in the last 24 hours, indicating a short-term increase in deposit activity. Such spikes often signal potential for increased near-term selling.

Source: CryptoQuant
Volume, wallet engagement showing healthy signs
On-chain indicators show encouraging growth. Transfer volume increased 73.2% over the last 24 hours, reflecting elevated coin movement. Additionally, active addresses rose by 11.06%, suggesting more wallet participation.
These metrics confirmed improving user engagement. However, total transaction count dropped slightly by 2.33%, which could reflect temporary consolidation rather than fading interest.

Source: CryptoQuant
LINK’s derivatives market shows mild bullish sentiment. The press time Funding Rate was 0.0090%, indicating that longs dominated, but without excessive leverage. Therefore, speculative pressure remained balanced.
Traders appear confident, but not overly aggressive. This measured optimism is constructive, especially as it limits risk of sudden liquidations.
Trend momentum confirmation?
The SuperTrend indicator has confirmed a fresh buy signal on LINK’s daily chart, as highlighted by Ali Charts. This indicator adds confidence to the ongoing bullish setup seen across lower timeframes.
Therefore, the signal reinforces the possibility of a sustained move higher.
If LINK closes above the $15.30 neckline, this SuperTrend shift could validate a broader market reversal. The alignment across trend indicators and structure increases the odds of breakout confirmation in the coming sessions.
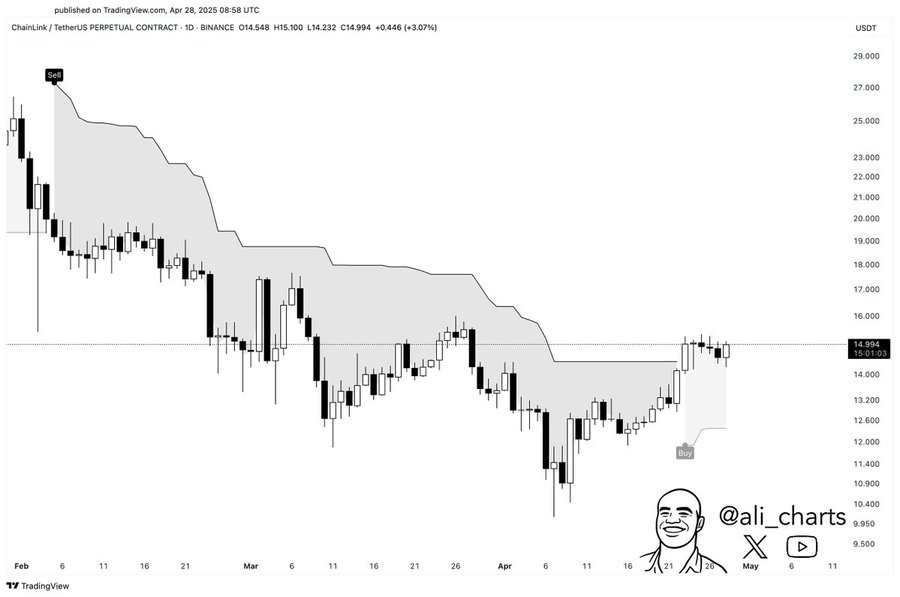
Source: X
Conclusion
Chainlink looks well-positioned to sustain a breakout if it closes decisively above the $15.30 neckline.
The alignment of bullish technical patterns, moving average crossover, rising on-chain activity, and a confirmed SuperTrend buy signal strengthens the breakout thesis.
Although short-term exchange inflows introduce slight caution, the broader outlook favors upside continuation. Therefore, a rally toward the $17 mark appears likely if the breakout is confirmed with volume.